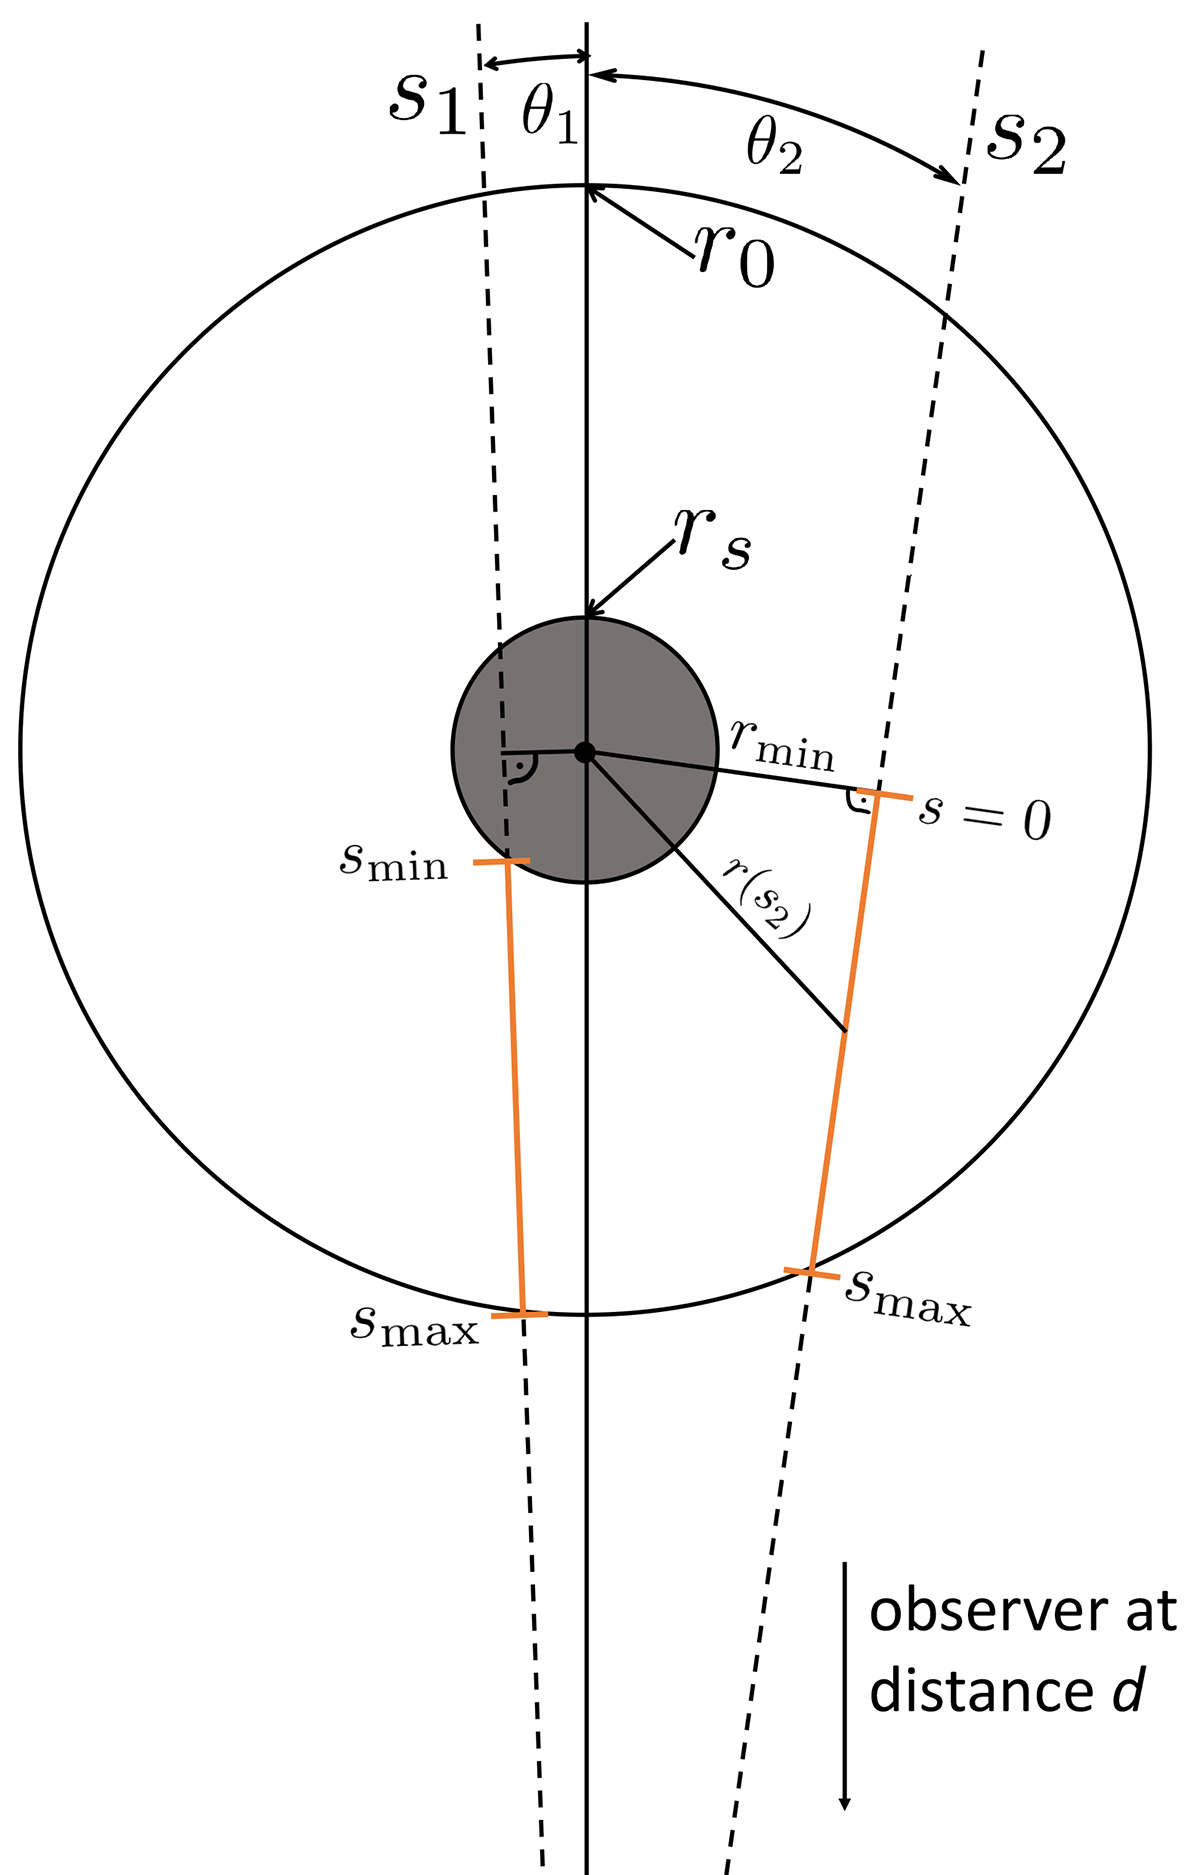
Fig. B.1.
Download original image
Illustration of the LOS integration. The pulsar in the centre is surrounded by a region with no emission, up to the shock radius rs (dark shaded region). We assume non-zero emission until the maximum radius of the nebula at r0. Here we illustrate two exemplary lines of sight s1 and s2 at angular offsets θ1 and θ2 with respect to the centre (dashed lines). s1 represents a line which intersects the shock whereas s2 does not. We integrate the emissivity jν along the parts of the lines that are marked in solid orange. Because of the radial symmetry of our model, these parts contain exactly half of the emission expected from the full LOS.
Current usage metrics show cumulative count of Article Views (full-text article views including HTML views, PDF and ePub downloads, according to the available data) and Abstracts Views on Vision4Press platform.
Data correspond to usage on the plateform after 2015. The current usage metrics is available 48-96 hours after online publication and is updated daily on week days.
Initial download of the metrics may take a while.