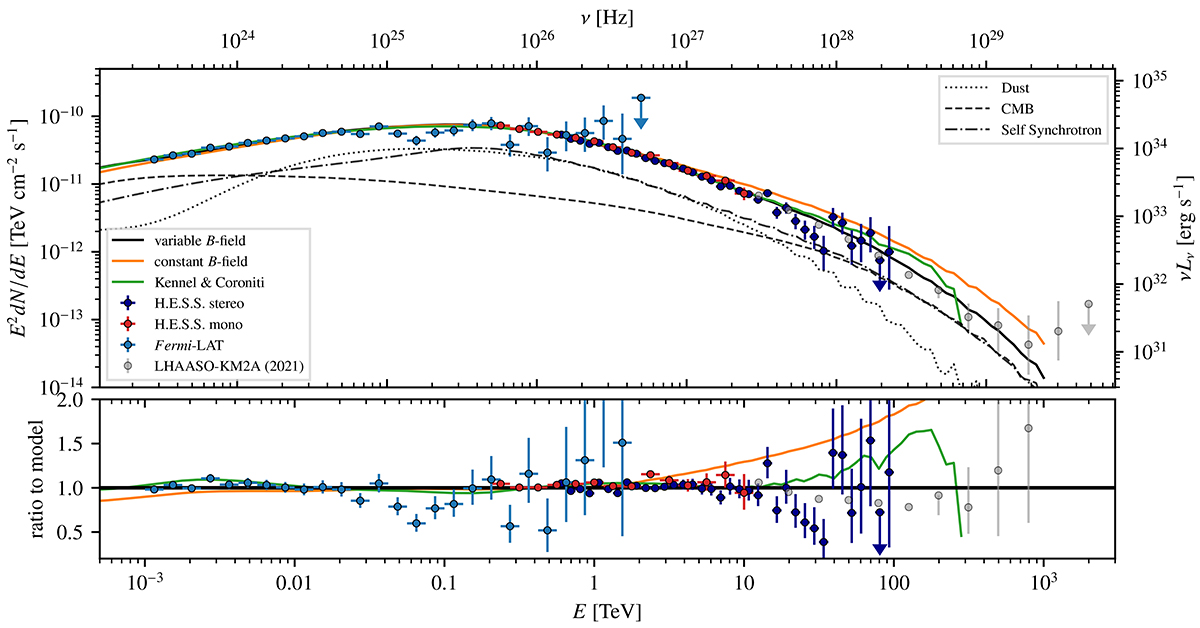
Fig. 12.
Download original image
IC flux predictions of the three models, together with the Fermi-LAT and H.E.S.S. flux points derived in this work. The LHAASO flux points, taken from Cao et al. (2021), are only shown for comparison. The dashed, dotted and dash-dotted lines show the individual contributions of seed photon fields for the variable B-field model. The bottom panel shows the ratio of the data points as well as the constant B-field and K&C model with respect to the variable B-field model.
Current usage metrics show cumulative count of Article Views (full-text article views including HTML views, PDF and ePub downloads, according to the available data) and Abstracts Views on Vision4Press platform.
Data correspond to usage on the plateform after 2015. The current usage metrics is available 48-96 hours after online publication and is updated daily on week days.
Initial download of the metrics may take a while.