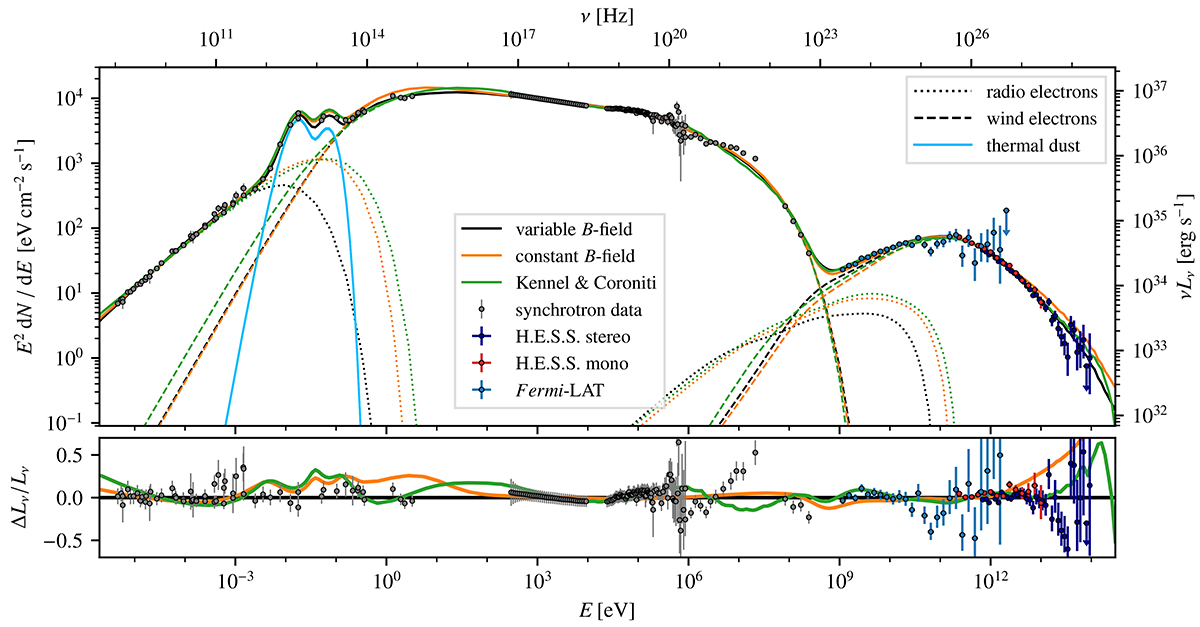
Fig. 11.
Download original image
SED of the Crab Nebula, together with the predictions of the three models. The dotted lines show the emission produced by the radio electrons, while dashed lines are for the wind electrons (where synchrotron emission from all electrons is always included as IC seed photon field). The total emission is shown by the solid lines. The light blue line denotes infrared dust emission (identical for all models). The synchrotron data points are the same as in Fig. 1, with a 7% systematic uncertainty added in quadrature. The IC data are from this work (cf. Figs. 2 and 4). The bottom panel shows the ratio of the data points as well as the constant B-field and K&C model with respect to the variable B-field model.
Current usage metrics show cumulative count of Article Views (full-text article views including HTML views, PDF and ePub downloads, according to the available data) and Abstracts Views on Vision4Press platform.
Data correspond to usage on the plateform after 2015. The current usage metrics is available 48-96 hours after online publication and is updated daily on week days.
Initial download of the metrics may take a while.