Fig. 9.
Download original image
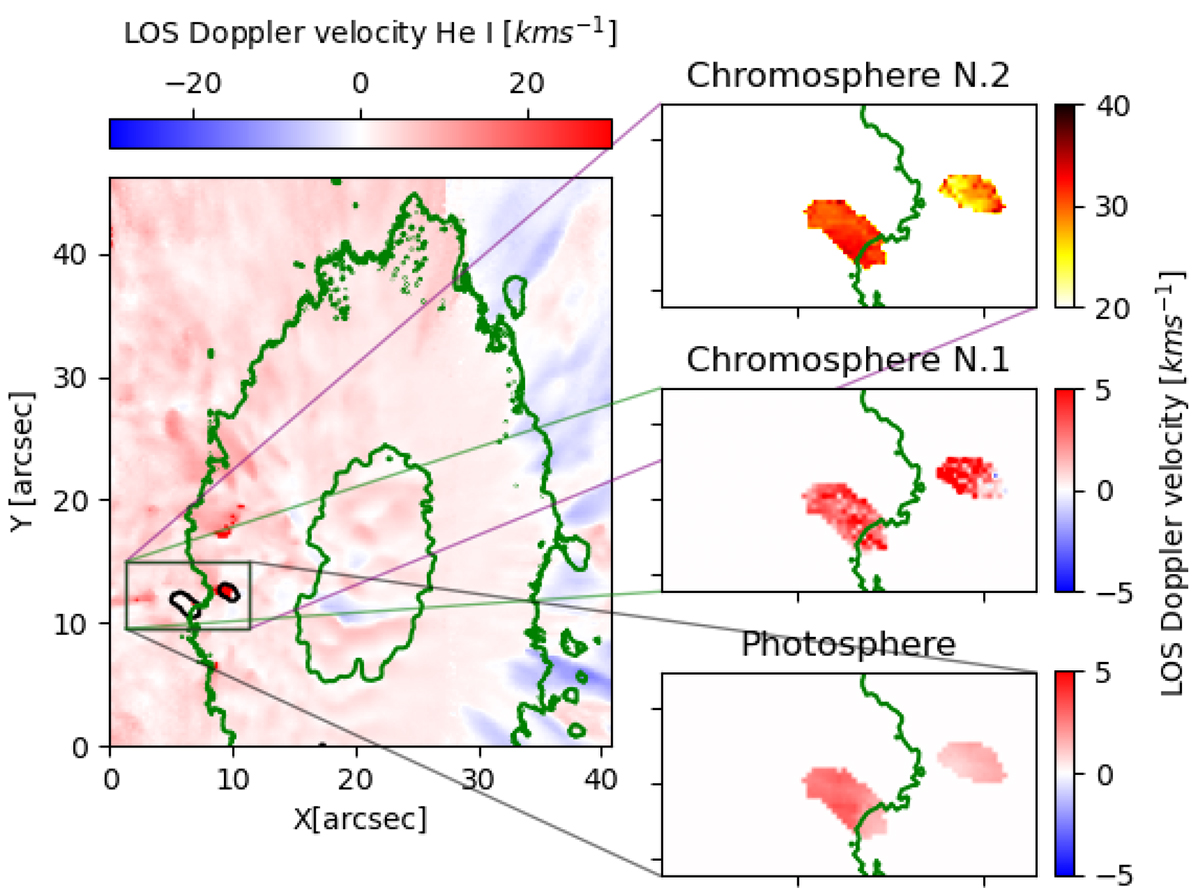
Overview of the helium doppler maps in the sunspot. The left helium Doppler map displays velocities inverted using a one-component atmosphere. The green contours show sunspot intensity boundaries. The purple contour shows areas with high Doppler shifts. The right images show results from inversions with two chromospheric models and one photospheric model. The green line shows the boundary between the penumbra, and the quiet Sun.
Current usage metrics show cumulative count of Article Views (full-text article views including HTML views, PDF and ePub downloads, according to the available data) and Abstracts Views on Vision4Press platform.
Data correspond to usage on the plateform after 2015. The current usage metrics is available 48-96 hours after online publication and is updated daily on week days.
Initial download of the metrics may take a while.