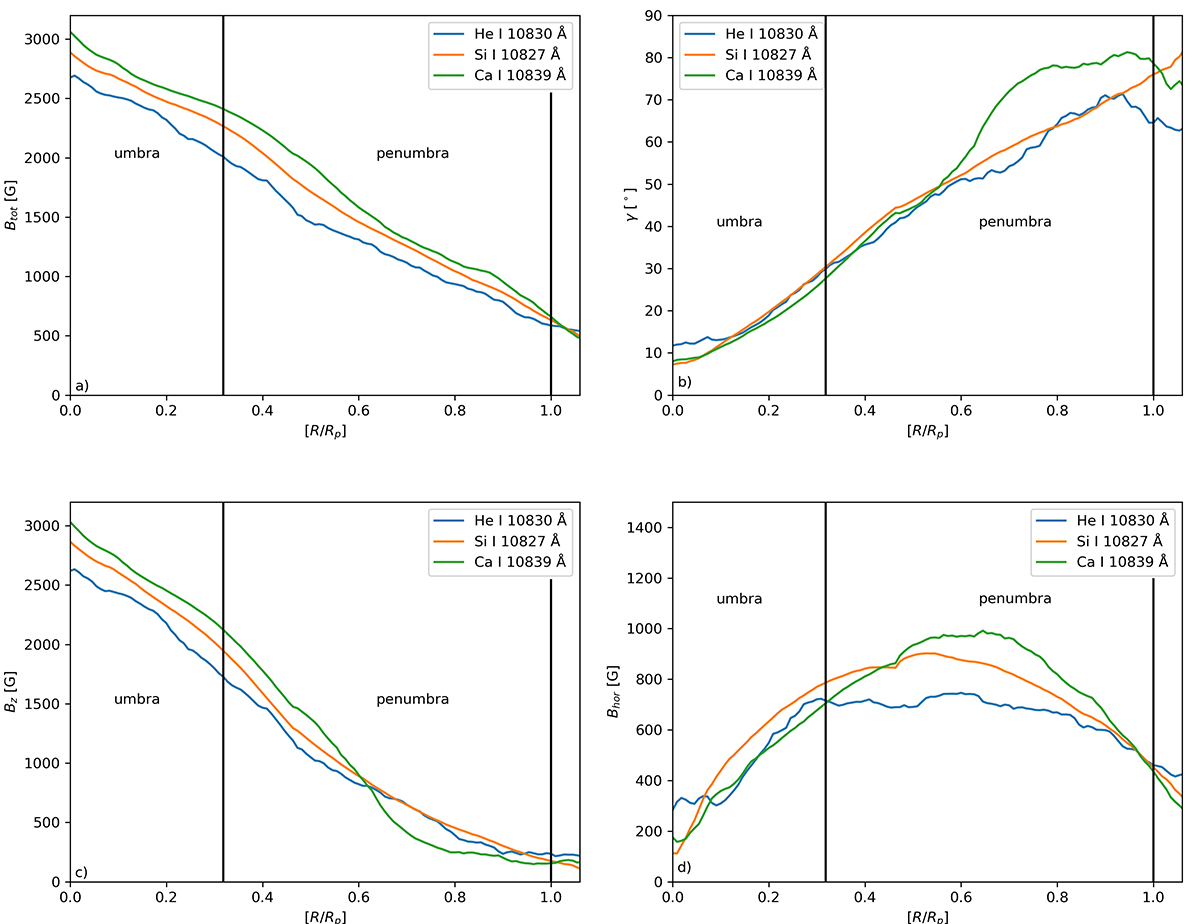
Fig. 6.
Download original image
Azimuthal averages of the magnetic field components (strength, Btot, inclination, γ, vertical component, Bz, and horizontal component, Bhor) at different distances from the sunspot center are shown. The data are presented for each spectral line in the umbra and penumbra. The x axis represents the distance from the center of the sunspot. The vertical black lines indicate the boundaries between the umbra and the penumbra and between the penumbra and the quiet Sun.
Current usage metrics show cumulative count of Article Views (full-text article views including HTML views, PDF and ePub downloads, according to the available data) and Abstracts Views on Vision4Press platform.
Data correspond to usage on the plateform after 2015. The current usage metrics is available 48-96 hours after online publication and is updated daily on week days.
Initial download of the metrics may take a while.