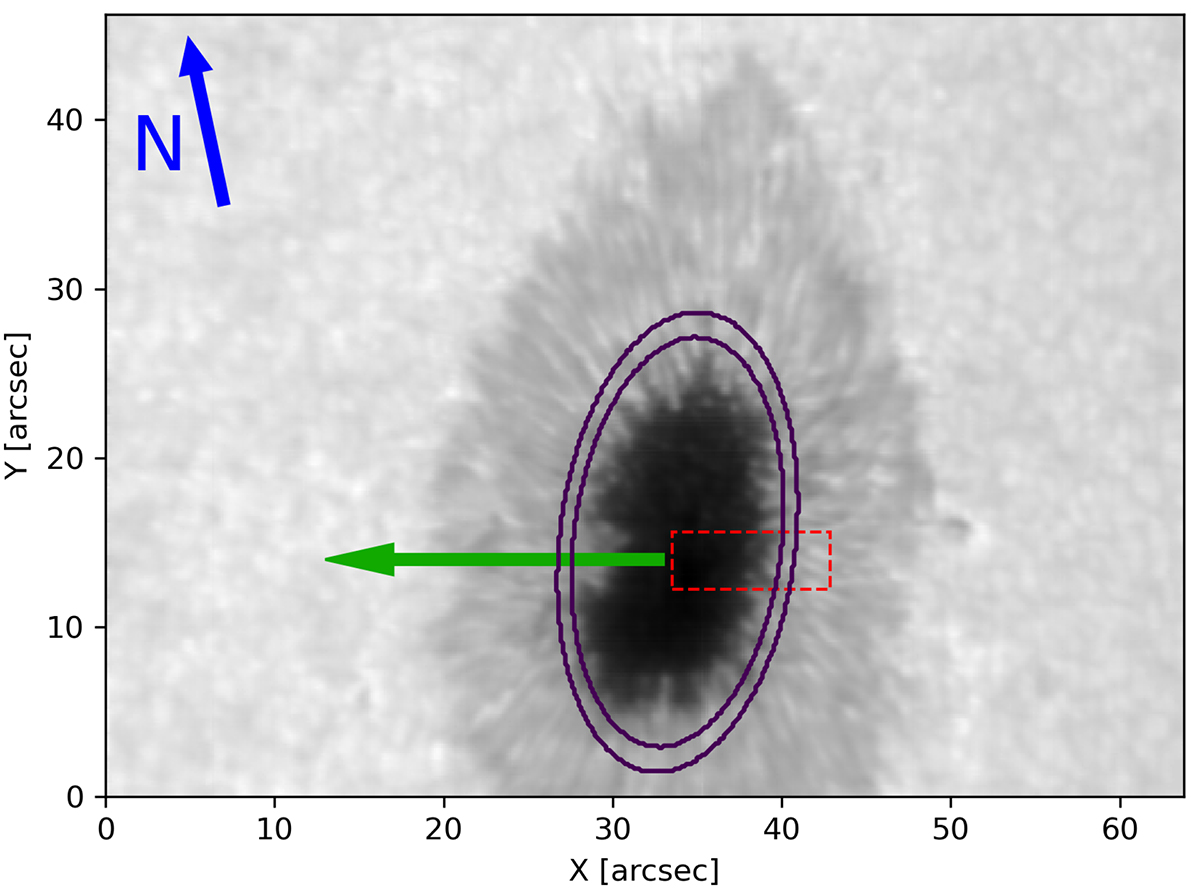
Fig. 1.
Download original image
Overview of the sunspot NOAA 12553 in the intensity of the spectral continuum, re-assembled from the scan. The x and y axes are given in arcseconds. The green arrow indicates the direction to the solar disk center. The blue arrow is pointing north. The highlighted red rectangle denotes the specific area chosen to calculate the height of spectral lines, as is described in Sect. 3.2. The purple ring limits the area near the Stokes-V-zero line chosen to calculate average magnetic field parameters, as is described in Sect. 4.1.
Current usage metrics show cumulative count of Article Views (full-text article views including HTML views, PDF and ePub downloads, according to the available data) and Abstracts Views on Vision4Press platform.
Data correspond to usage on the plateform after 2015. The current usage metrics is available 48-96 hours after online publication and is updated daily on week days.
Initial download of the metrics may take a while.