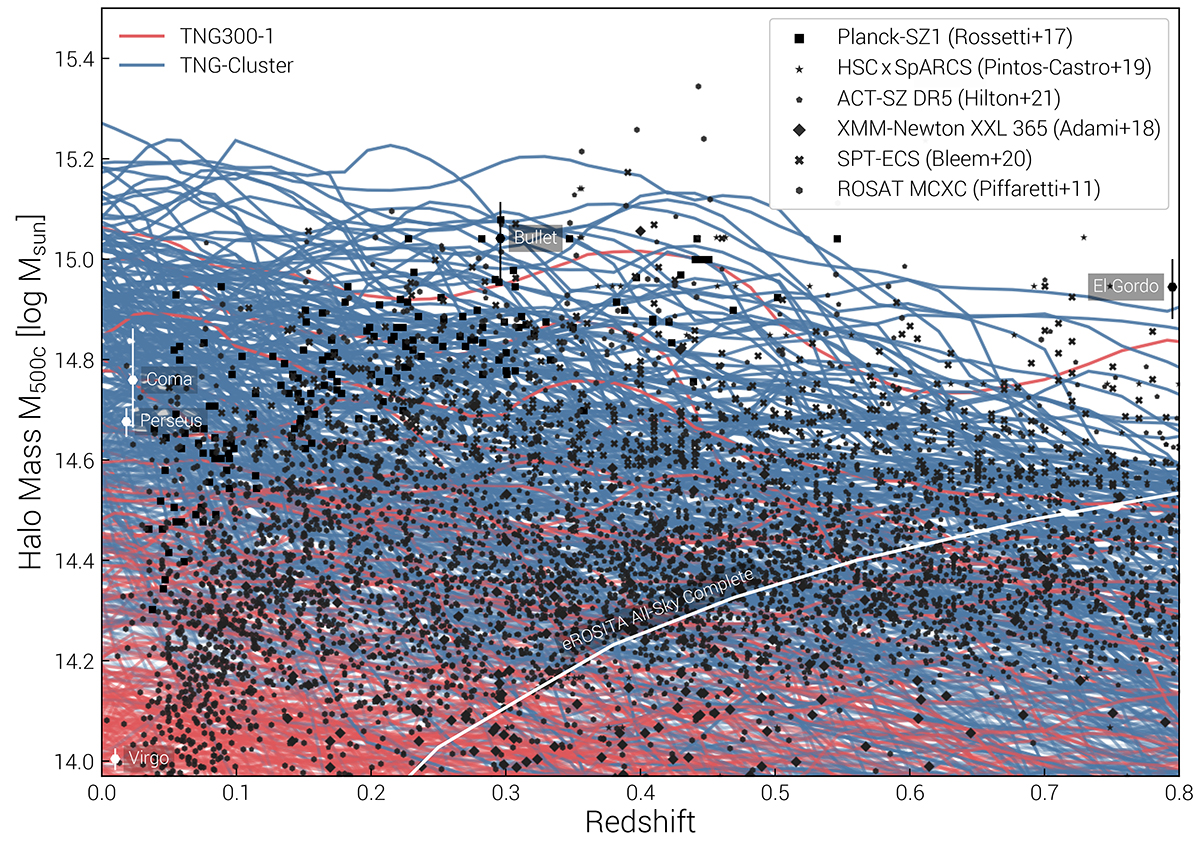
Fig. 3.
Download original image
Combined sample of TNG-Cluster (blue) and TNG300 (red), showing M500c halo mass as a function of redshift. The mass assembly history of each z = 0 cluster is shown as a single line. For reference, we compare to observational samples of galaxy clusters from large surveys/survey instruments including Planck, ACT, ROSAT, and SPT (black markers; see text for details). Several notable low-redshift named clusters are also included for comparison in this mass-redshift plane – Virgo, Coma, Perseus, the Bullet Cluster, and El Gordo (points with errorbars; see text for details). The TNG-Cluster sample, in blue, is essential to compare to the most massive detected galaxy clusters, from z = 0 to cosmic noon.
Current usage metrics show cumulative count of Article Views (full-text article views including HTML views, PDF and ePub downloads, according to the available data) and Abstracts Views on Vision4Press platform.
Data correspond to usage on the plateform after 2015. The current usage metrics is available 48-96 hours after online publication and is updated daily on week days.
Initial download of the metrics may take a while.