Fig. 16.
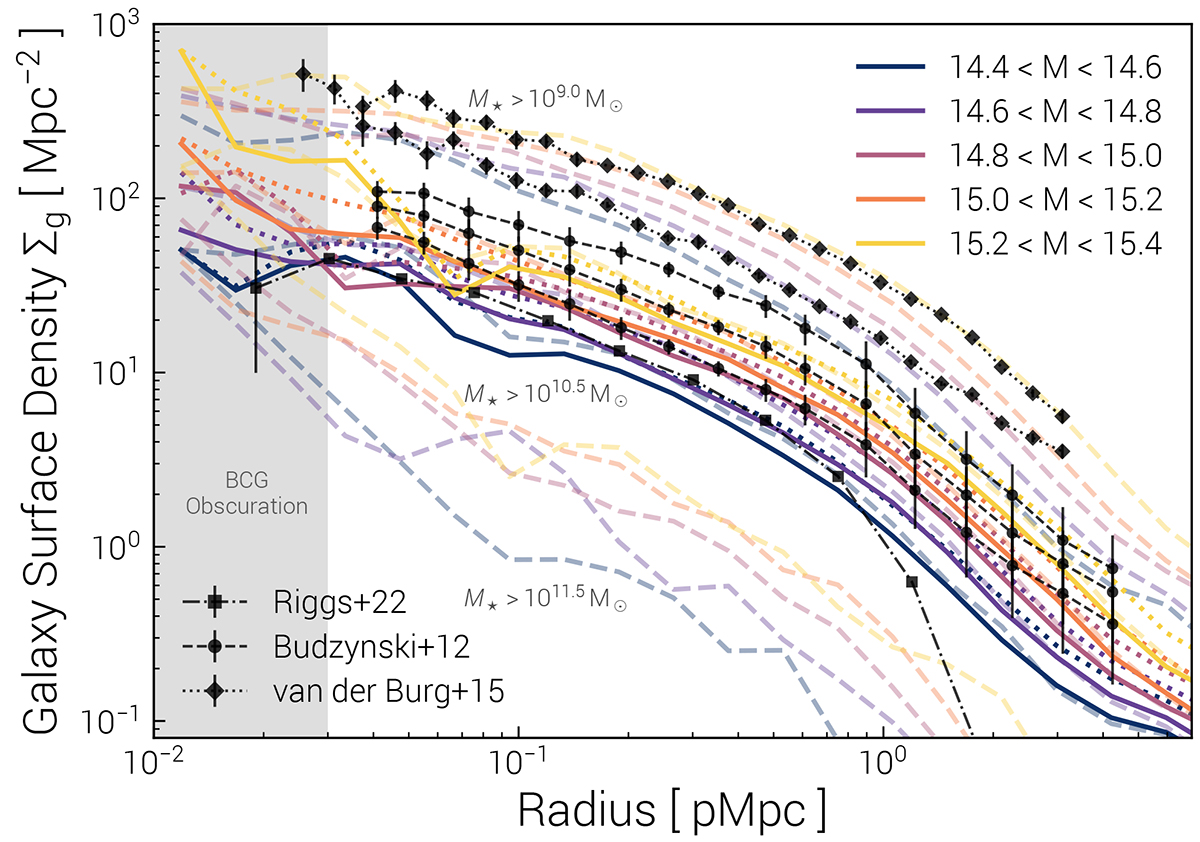
Download original image
Radial distribution of nearby (satellite) galaxies, from the centers of TNG-Cluster halos at z = 0. We show the surface number density, that is, the number of galaxies per Mpc2, as a function of distance. We stack around clusters in five halo mass bins, as indicated in the legend for M200c in log M⊙. We include galaxies with Mr < −20.5 mag (thick solid lines including dust modeling, dotted lines without; see text) in order to match observational constraints from SDSS (Budzynski et al. 2012, black circles and dashed lines;). We also compare to data from GAMA (black squares and dot-dash line; Riggs et al. 2022). In addition we include stellar mass based constraints with three additional sets of dashed colored lines: M⋆ > {109, 1010.5, 1011.5} M⊙. The first (highest) set of colored curves are comparable to observational constraints from van der Burg et al. (2015, as described in the text).
Current usage metrics show cumulative count of Article Views (full-text article views including HTML views, PDF and ePub downloads, according to the available data) and Abstracts Views on Vision4Press platform.
Data correspond to usage on the plateform after 2015. The current usage metrics is available 48-96 hours after online publication and is updated daily on week days.
Initial download of the metrics may take a while.