Open Access
Fig. 11.
Download original image
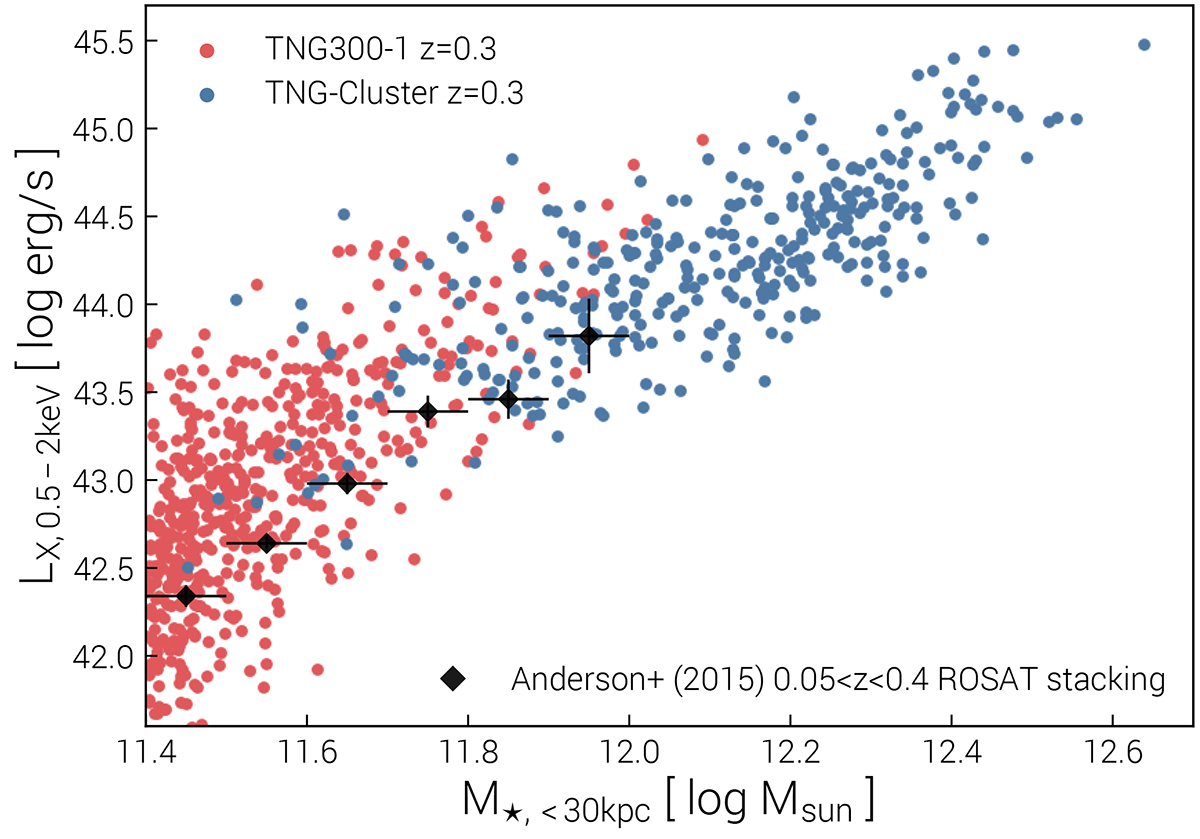
X-ray scaling relation vs galaxy stellar mass. We show TNG300 (red) and TNG-Cluster (blue) both at z = 0.3, which is the average redshift of the observational sample of Anderson et al. (2015), based on ROSAT stacking around locally brightest galaxies from SDSS.
Current usage metrics show cumulative count of Article Views (full-text article views including HTML views, PDF and ePub downloads, according to the available data) and Abstracts Views on Vision4Press platform.
Data correspond to usage on the plateform after 2015. The current usage metrics is available 48-96 hours after online publication and is updated daily on week days.
Initial download of the metrics may take a while.