Fig. 7.
Download original image
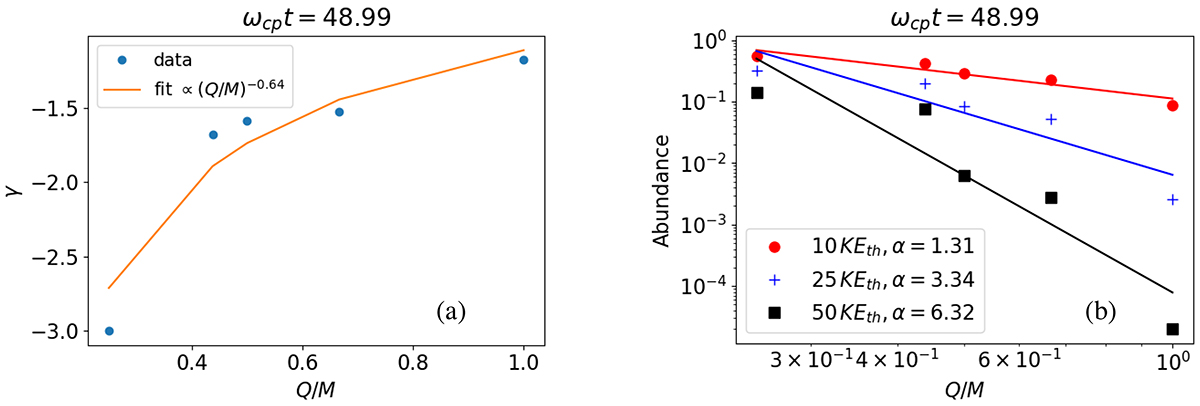
Spectral index γ of the energy-per-nucleon spectra in the shoulder region vs. Q/M and the fit γ ∝ (Q/M)−0.64 (a). Scaling of the proxy of the ion abundance, defined as number of particles above a threshold energy normalized to the total number of particles, with Q/M for threshold energy 10 (red filled circles), 25 (blue plus signs), and 50 (black filled squares) times the initial thermal energy KEth (b). The straight lines are the fit, abundance ∝(Q/M)−α, for the data and are plotted with the color corresponding to the data.
Current usage metrics show cumulative count of Article Views (full-text article views including HTML views, PDF and ePub downloads, according to the available data) and Abstracts Views on Vision4Press platform.
Data correspond to usage on the plateform after 2015. The current usage metrics is available 48-96 hours after online publication and is updated daily on week days.
Initial download of the metrics may take a while.