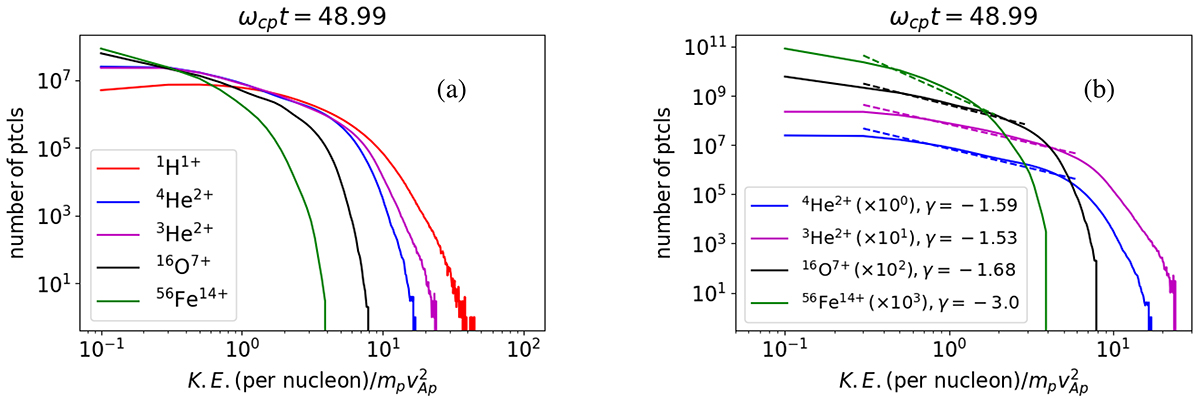
Fig. 6.
Download original image
Energy-per-nucleon spectra at ωcpt = 48.99. The original spectra of different ion species (a) and spectra of heavy ions shifted for visibility on the y-axis by a factor of 100, 101, 102, and 103 for 4He2+, 3He2+, 16O7+, and 56Fe14+, respectively (b). The dashed lines in the right panel are the power-law fit (Eγ) to the shoulder region of the spectra, where E is the energy-per-nucleon.
Current usage metrics show cumulative count of Article Views (full-text article views including HTML views, PDF and ePub downloads, according to the available data) and Abstracts Views on Vision4Press platform.
Data correspond to usage on the plateform after 2015. The current usage metrics is available 48-96 hours after online publication and is updated daily on week days.
Initial download of the metrics may take a while.