Open Access
Fig. 4.
Download original image
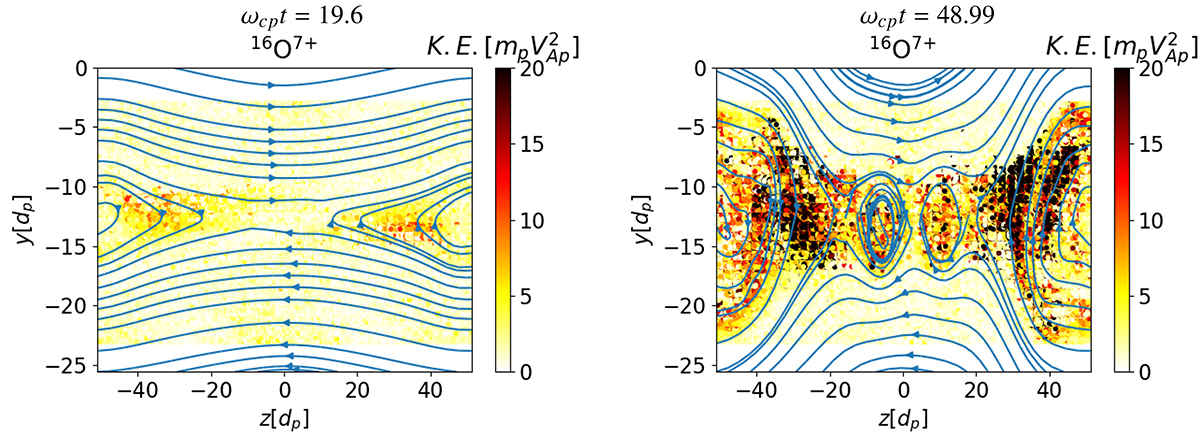
Positions of 16O7+ ions represented by dots color-coded according to the ions’ kinetic energy at ωcpt = 19.6 (left column) and ωcpt = 48.99 (right column). The lines with arrows represent magnetic field lines. Only the lower half (y < 0) of the simulation domain is shown.
Current usage metrics show cumulative count of Article Views (full-text article views including HTML views, PDF and ePub downloads, according to the available data) and Abstracts Views on Vision4Press platform.
Data correspond to usage on the plateform after 2015. The current usage metrics is available 48-96 hours after online publication and is updated daily on week days.
Initial download of the metrics may take a while.