Fig. 6
Download original image
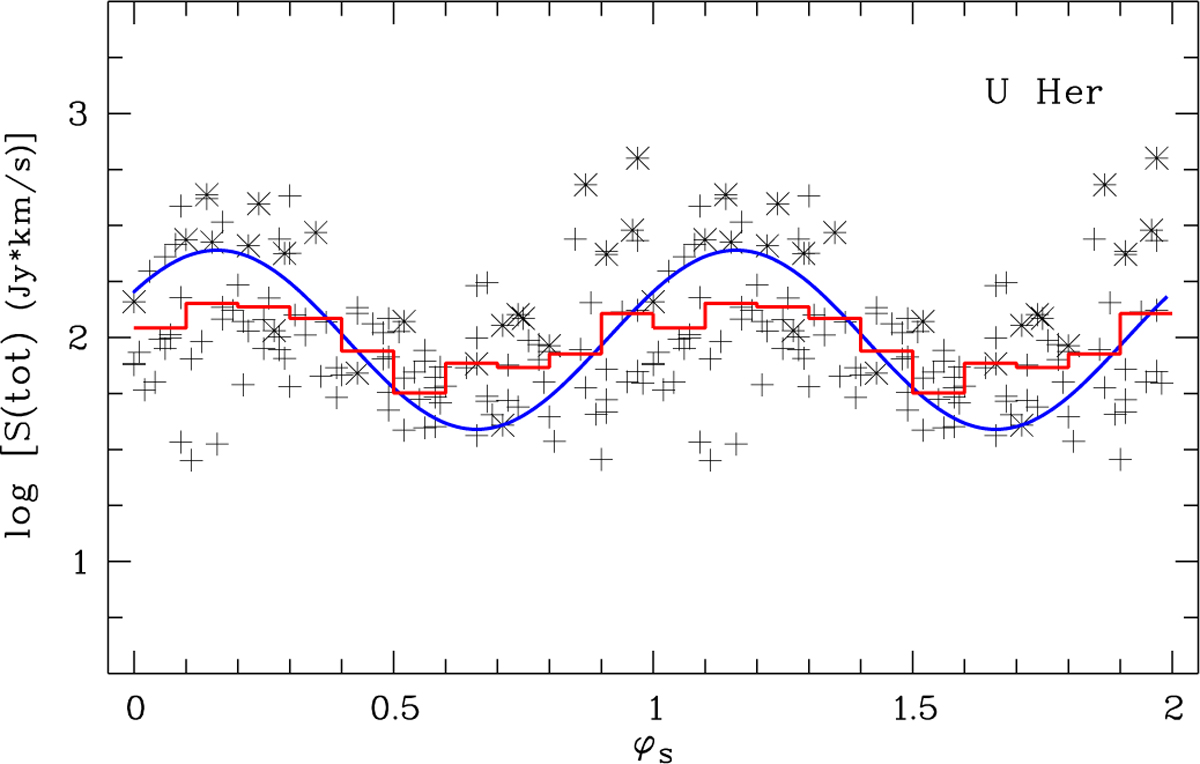
U Her H2O maser light curve. Plotted are integrated flux densities S(tot) in the velocity range −24 < Vlos < −6 km s−1 in Jy km s−1 vs. optical phase φs. For better visualization the data are repeated for a second period. φs = 0 is defined as the time of maximum optical brightness. Datapoints marked by an asterisk (*) are from Eſſelsberg, the plusses (+) are Medicina data. Overplotted are average integrated flux densities in phase bins of 0.1 (red), and a sine curve (blue) which was obtained by a fit to the 1990–2011 radio measurements with a period of Popt = 405 days. The sine curve is delayed by ϕlag = 0.16, i.e. by 64 days with respect to the optical maximum.
Current usage metrics show cumulative count of Article Views (full-text article views including HTML views, PDF and ePub downloads, according to the available data) and Abstracts Views on Vision4Press platform.
Data correspond to usage on the plateform after 2015. The current usage metrics is available 48-96 hours after online publication and is updated daily on week days.
Initial download of the metrics may take a while.