Open Access
Fig. 21
Download original image
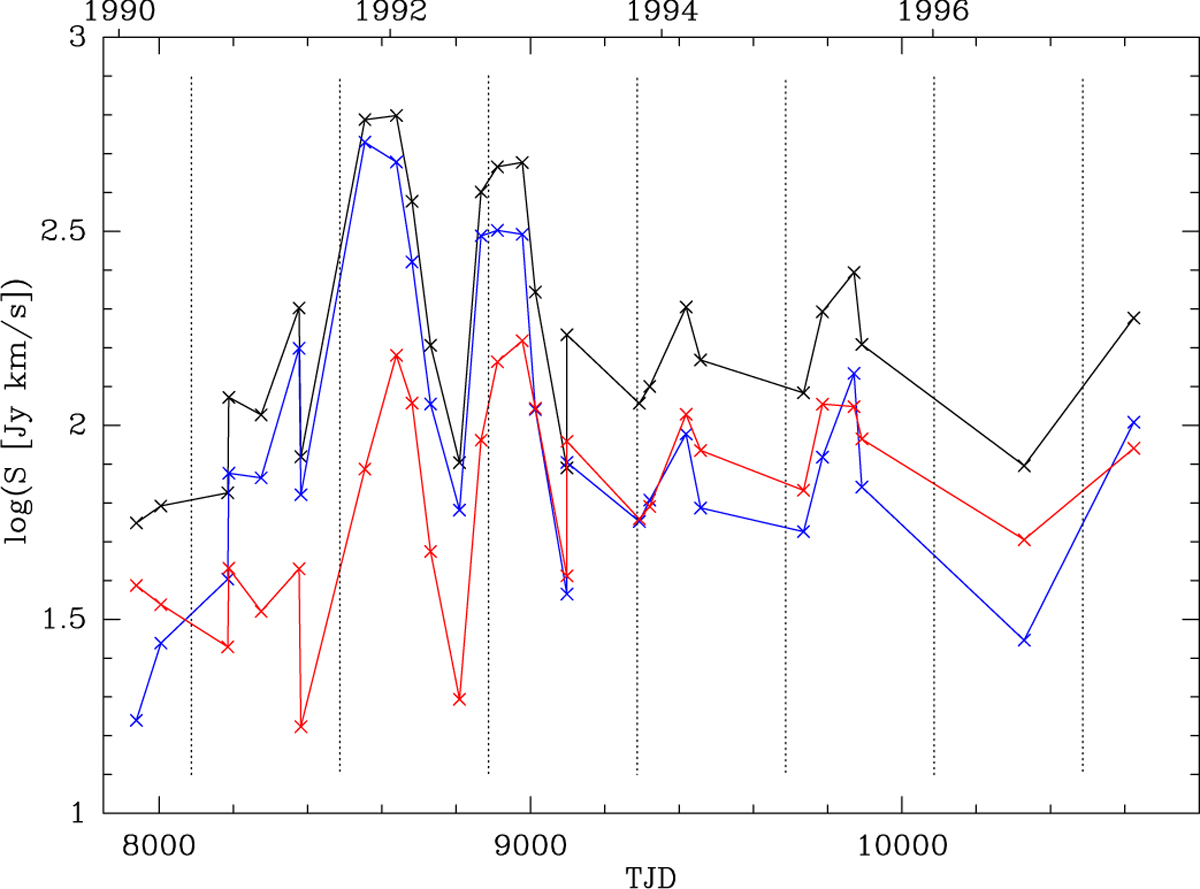
RR Aql Medicina/Effelsberg H2O maser light curves 1990 - 1997 of RR Aql showing the emission in the Vlos < 28.5 and >28.5 km s−1 part of the maser velocity range in blue and red colour respectively. The sum of both (in black) is the integrated flux densities 5 (tot) as shown in Fig. 20. Vertical dotted lines as in Fig. 20.
Current usage metrics show cumulative count of Article Views (full-text article views including HTML views, PDF and ePub downloads, according to the available data) and Abstracts Views on Vision4Press platform.
Data correspond to usage on the plateform after 2015. The current usage metrics is available 48-96 hours after online publication and is updated daily on week days.
Initial download of the metrics may take a while.