Fig. 2
Download original image
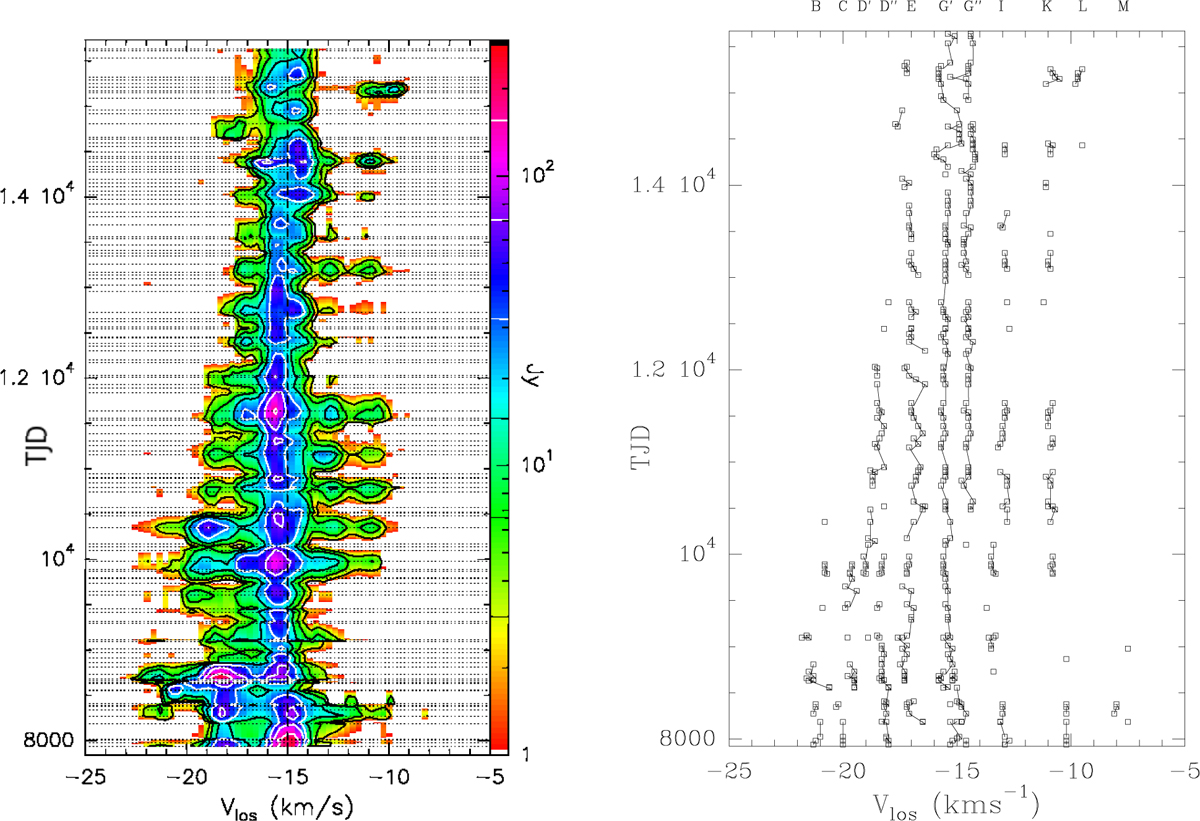
Maser profiles of U Her as a function of time. Left: flux density versus Vlos as a function of time (FVt)-plot for U Her. Each horizontal dotted line indicates an observation (spectra taken within 4 days from each other were averaged). Data are resampled to a resolution of 0.3 km s−1 and only emission at levels ≥3σ and ≥l Jy is shown. The first spectrum in this plot was taken on 16 February 1990; JD = 2 447 938.5, TJD = 7938. Last spectrum shown is for 20 March 2011. Right: spectral components identified by the component fit of the single-dish spectra as listed in Tables A.1 and A.2 (see also Sect. 4.1.7). The component designations are given above the plot. Features which have been detected in adjacent spectra, are connected by solid lines.
Current usage metrics show cumulative count of Article Views (full-text article views including HTML views, PDF and ePub downloads, according to the available data) and Abstracts Views on Vision4Press platform.
Data correspond to usage on the plateform after 2015. The current usage metrics is available 48-96 hours after online publication and is updated daily on week days.
Initial download of the metrics may take a while.