Open Access
Fig. 19
Download original image
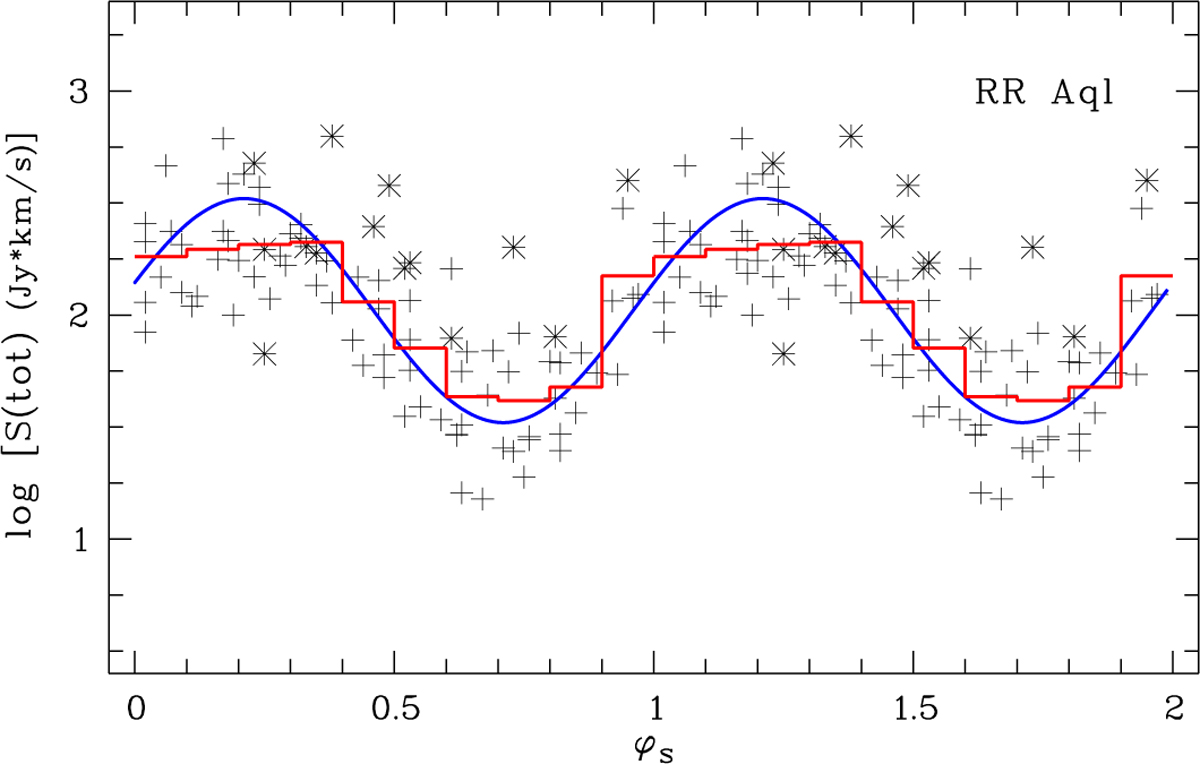
RR Aql H2O maser light curve. See Fig. 6 for details. 5 (tot) was determined in the velocity range 22 < Vlos < 34 km s−1. The sine curve (blue) was obtained by a fit to the 1990–2011 radio measurements with a period Popt = 400 days and is delayed by ϕlag = 0.21, i.e. by 84 days with respect to the optical light curve.
Current usage metrics show cumulative count of Article Views (full-text article views including HTML views, PDF and ePub downloads, according to the available data) and Abstracts Views on Vision4Press platform.
Data correspond to usage on the plateform after 2015. The current usage metrics is available 48-96 hours after online publication and is updated daily on week days.
Initial download of the metrics may take a while.