Fig. 15
Download original image
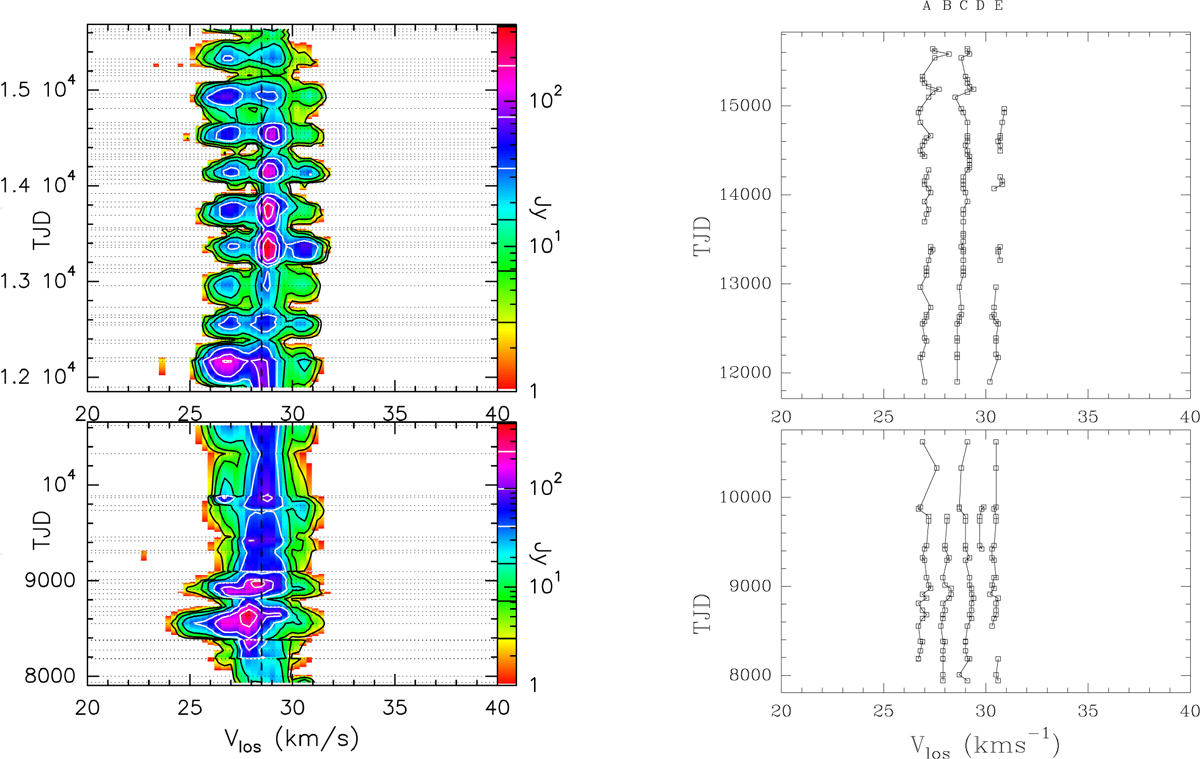
Maser profiles as a function of time for RR Aql. Left: FVt-plot for RR Aql (cf. Fig. 2 for details). First spectrum: 17 February 1990; JD = 2 447 939.5, TJD = 7939. and last spectrum: 25 June 1997 (lower panel). First spectrum: 20 December 2000 and last spectrum: 20 March 2011 (upper panel). Right: spectral components identified by the component fit of the single-dish spectra as listed in Table B.1.
Current usage metrics show cumulative count of Article Views (full-text article views including HTML views, PDF and ePub downloads, according to the available data) and Abstracts Views on Vision4Press platform.
Data correspond to usage on the plateform after 2015. The current usage metrics is available 48-96 hours after online publication and is updated daily on week days.
Initial download of the metrics may take a while.