Fig. 10
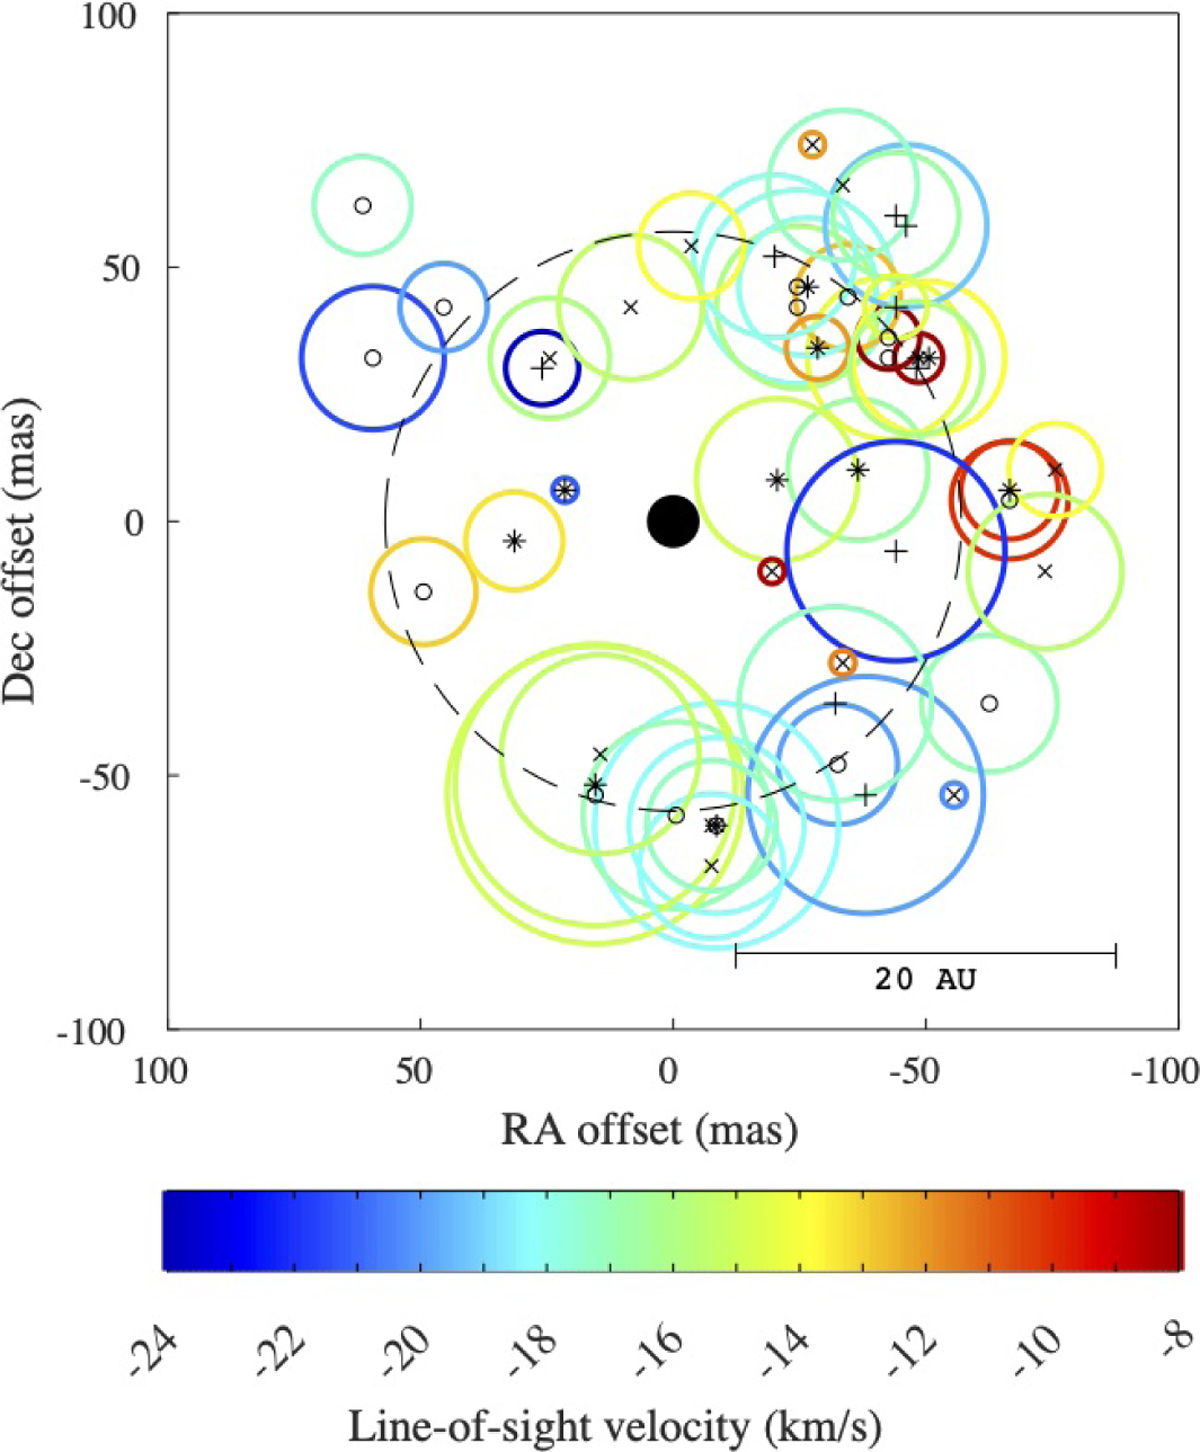
Download original image
All the spatial components of U Her listed in Table 3 plotted on the sky. Each component is represented by a symbol surrounded by a circle with a diameter d depending on flux density Sν: d = 8 (log Sν + 1.3). The dates are represented by different symbols: Feb. 90 by small circles; Jun. 90 by asterisks; Oct. 91 by plus signs; Dec. 92 by crosses. The circles around the components are colour coded according to the Vlos of the component (see the scale below the map). The dashed circle with a radius of 57 mas has been obtained from a fit to the components with velocities −18 < Vlos < −14 km s−1 (see text) and the origin of the plot has been moved to the centre of this circle. The filled black circle at the centre symbolises the central star with a diameter of 10.65 mas (van Belle et al. 1996).
Current usage metrics show cumulative count of Article Views (full-text article views including HTML views, PDF and ePub downloads, according to the available data) and Abstracts Views on Vision4Press platform.
Data correspond to usage on the plateform after 2015. The current usage metrics is available 48-96 hours after online publication and is updated daily on week days.
Initial download of the metrics may take a while.