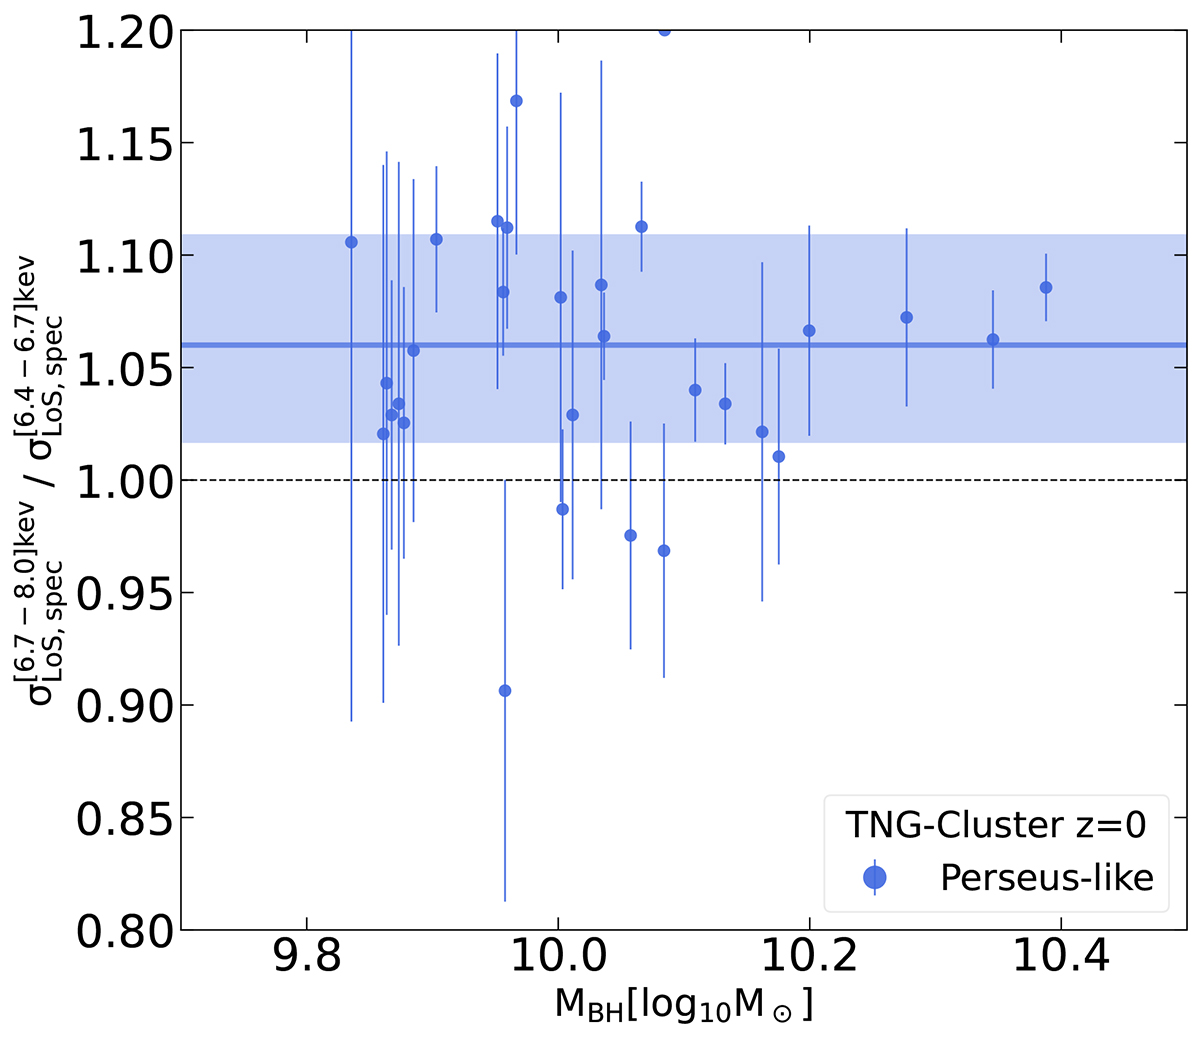
Fig. 8.
Download original image
Comparison of the inferred velocity dispersion of the ICM in the core of clusters derived from low-energy vs. higher-energy spectral lines. In particular, we plot the ratio of spectral-fit LoS velocity dispersions using two different X-ray bands: [6.7−8.0] keV versus [6.4−6.7] keV, as a function of SMBH mass. The solid line represents the median relation, whereas the shaded area specifies the 16th−84th envelope. For the Perseus-like sample, the ratio is systematically larger than 1, although by only 6−10%.
Current usage metrics show cumulative count of Article Views (full-text article views including HTML views, PDF and ePub downloads, according to the available data) and Abstracts Views on Vision4Press platform.
Data correspond to usage on the plateform after 2015. The current usage metrics is available 48-96 hours after online publication and is updated daily on week days.
Initial download of the metrics may take a while.