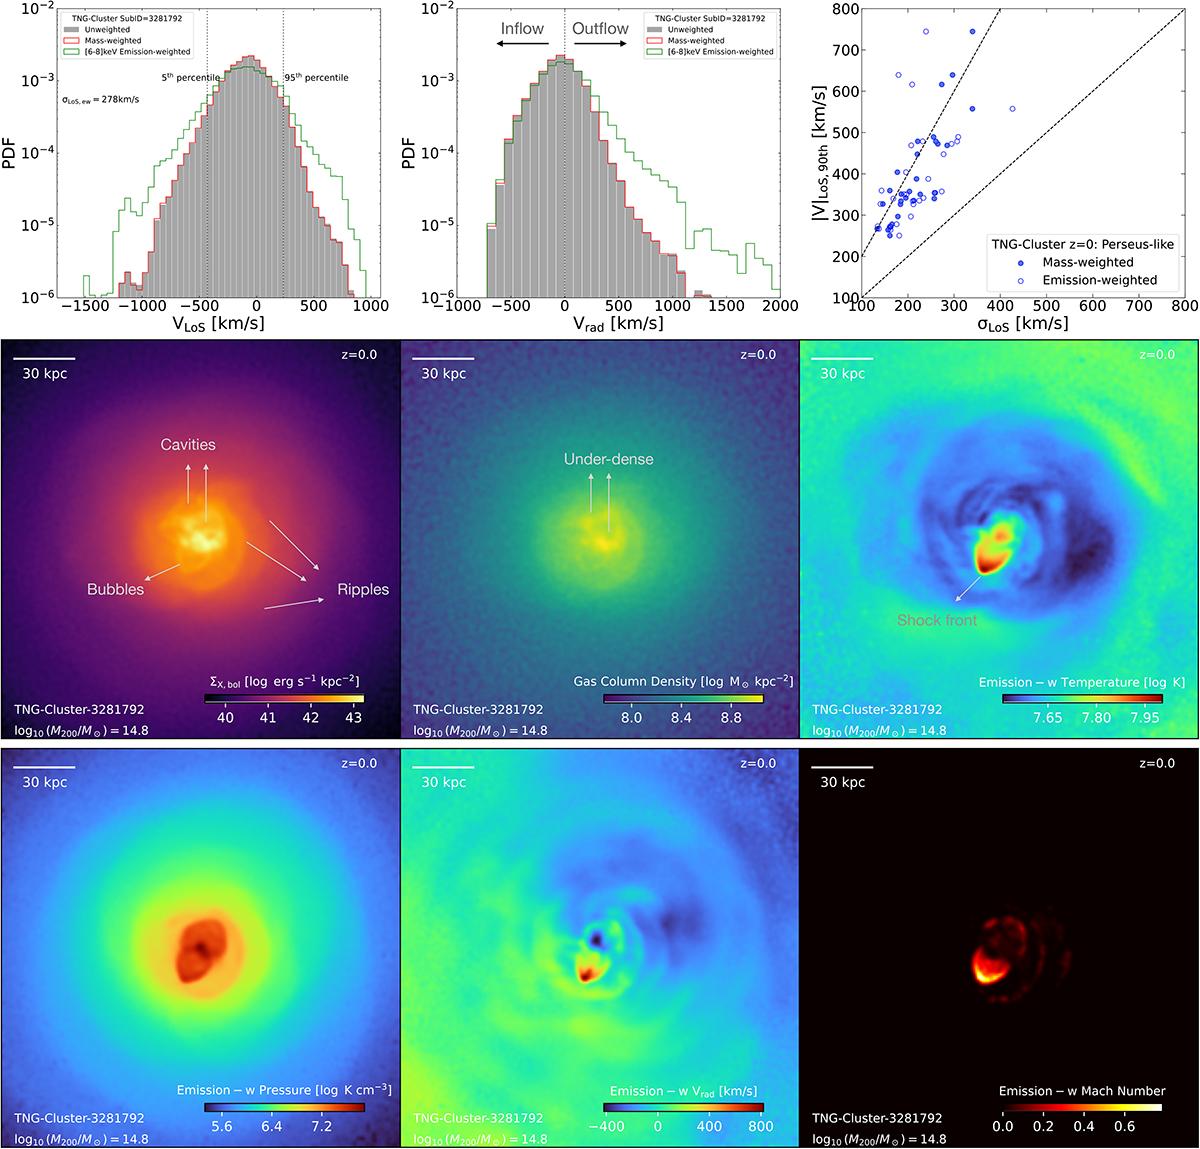
Fig. 7.
Download original image
Connecting the line-of-sight velocity dispersion of the ICM in cluster cores to the velocity distribution, high-velocity outflows, and morphological features with TNG-Cluster. In this figure, the top left/middle and bottom panels show one individual Perseus-like cluster, whereas the top right panel provides a statistical view across the entire TNG-Cluster Perseus-like sample at z = 0. In particular, the top left (middle) panels show the 1D histogram of LoS (radial) velocity of the ICM within the core of 70 kpc. It demonstrates that bulk motions of relatively small fractions of the gas can make such distributions deviate from a Gaussian, such that the X-ray derived velocity dispersion does not fully capture the complexity of the velocity structure of the cluster. The bottom panel provides maps of the gas thermodynamical and kinematic properties (200 kpc a size for a full projection). Finally, the top right panel shows the correlation between the LoS velocity dispersion versus the 90th percentile of the absolute value of the LoS velocity, with the latter weighted by mass or X-ray emission. Dashed lines show the 1:1 and 2:1 relations. In TNG-Cluster Perseus-like systems, the velocity of the fastest-moving gas is greater than the velocity dispersion by approximately a factor of 2. Moreover, it is the fastest-moving gas that is chiefly responsible for the spatial features and fluctuations of the X-ray surface brightness maps.
Current usage metrics show cumulative count of Article Views (full-text article views including HTML views, PDF and ePub downloads, according to the available data) and Abstracts Views on Vision4Press platform.
Data correspond to usage on the plateform after 2015. The current usage metrics is available 48-96 hours after online publication and is updated daily on week days.
Initial download of the metrics may take a while.