Fig. 5.
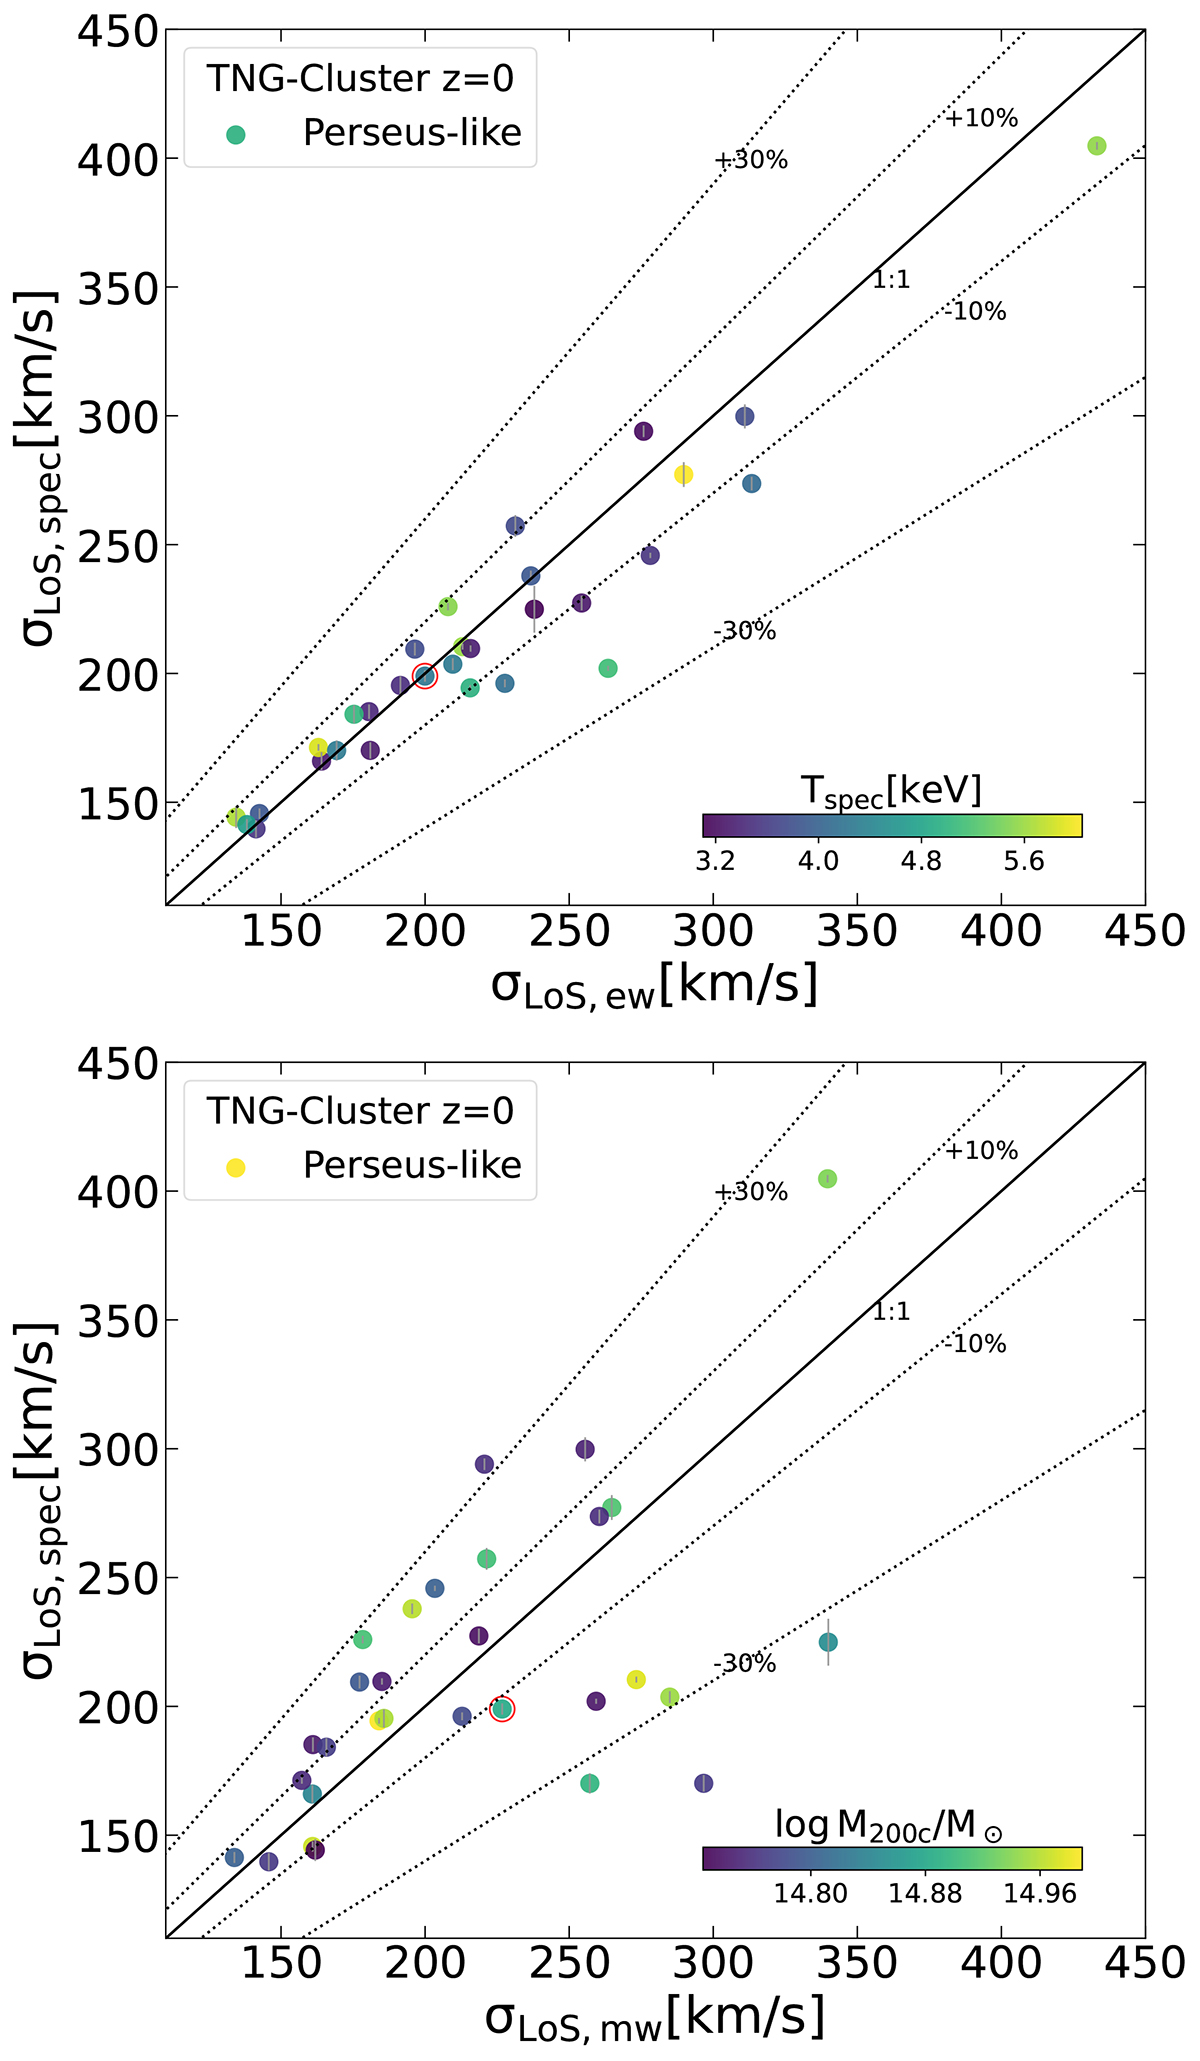
Download original image
Intrinsic versus X-ray inferred velocity dispersion of the gas in cluster cores. We compare the LoS spectral-fit values with intrinsic, emission-weighted (top) and mass-weighted (bottom) LoS velocity dispersion. The data points are colour coded according to either Tspec or M200c. The intrinsic values use all gas within a core region with a side of 70 kpc – the XRISM field of view – but excluding the innermost volume with radius of 10 kpc. The solid lines specify the 1:1 relation, whereas the dotted lines present the ±10% and ±30% deviations from the 1:1 relation. The red circle denotes the example cluster whose spectrum is shown in Fig. 3.
Current usage metrics show cumulative count of Article Views (full-text article views including HTML views, PDF and ePub downloads, according to the available data) and Abstracts Views on Vision4Press platform.
Data correspond to usage on the plateform after 2015. The current usage metrics is available 48-96 hours after online publication and is updated daily on week days.
Initial download of the metrics may take a while.