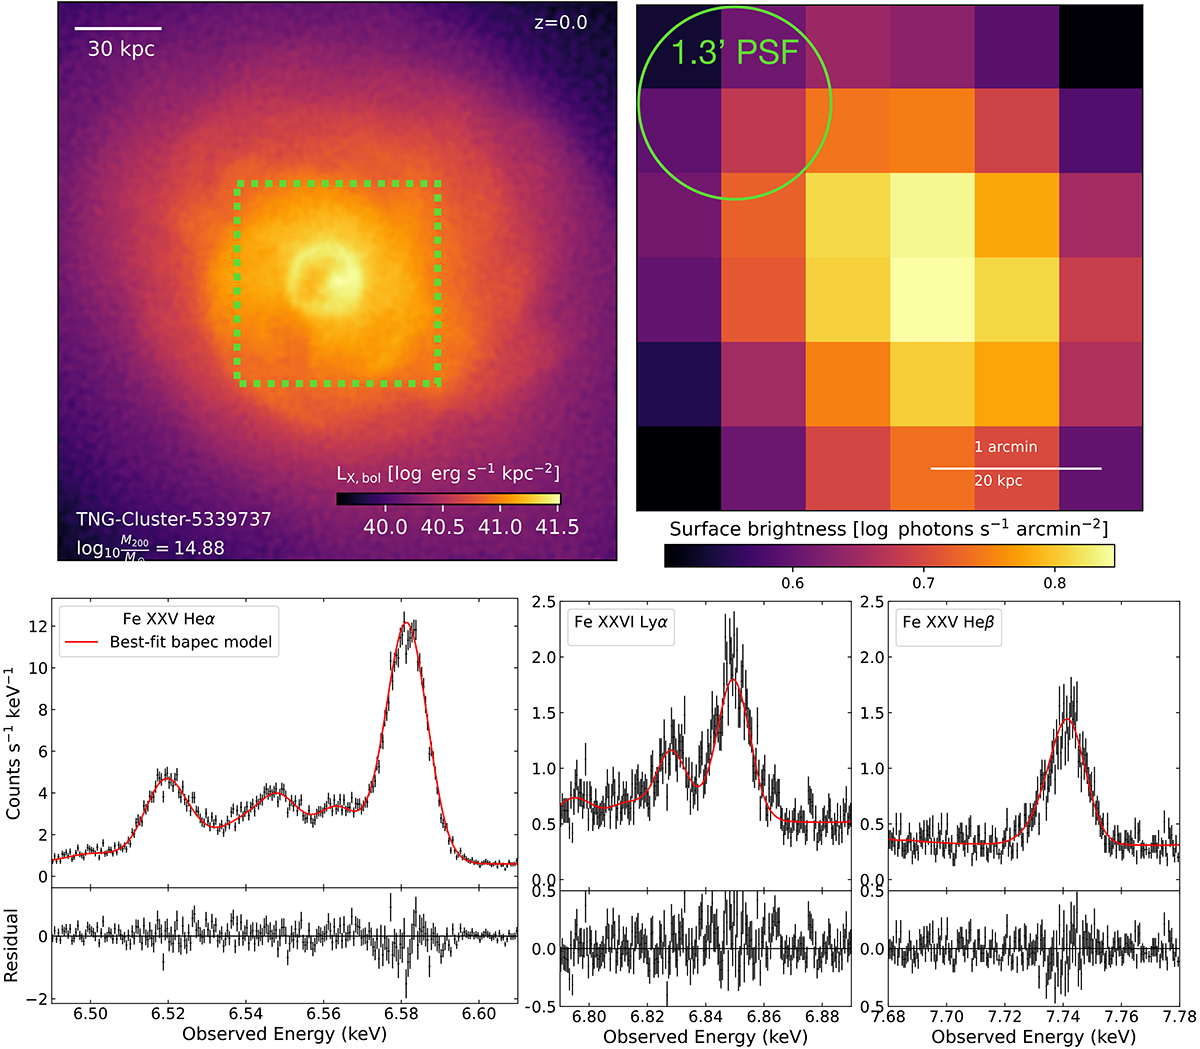
Fig. 3.
Download original image
Illustration of the end-to-end mock X-ray analysis applied to TNG-Cluster to mimic observations with XRISM Resolve. We showcase the process described in Sect. 2 for a single randomly selected Perseus-like cluster for an exposure of 100 ks. In the top left panel, we first show the intrinsic X-ray surface brightness map of the simulated cluster, which is similar to those of Fig. 1, in which the central green square specifies the approximate FoV of XRISM Resolve (∼70 × 70 kpc). The top right panel then shows the count-rate map via the mock observation. Bottom: segments of the associated mock spectrum that resolve individual lines at the Fe XXV Heα complex, Fe XXVI Lyα, and Fe XXV Heβ, with the best-fit bapec model overlaid.
Current usage metrics show cumulative count of Article Views (full-text article views including HTML views, PDF and ePub downloads, according to the available data) and Abstracts Views on Vision4Press platform.
Data correspond to usage on the plateform after 2015. The current usage metrics is available 48-96 hours after online publication and is updated daily on week days.
Initial download of the metrics may take a while.