Fig. 7.
Download original image
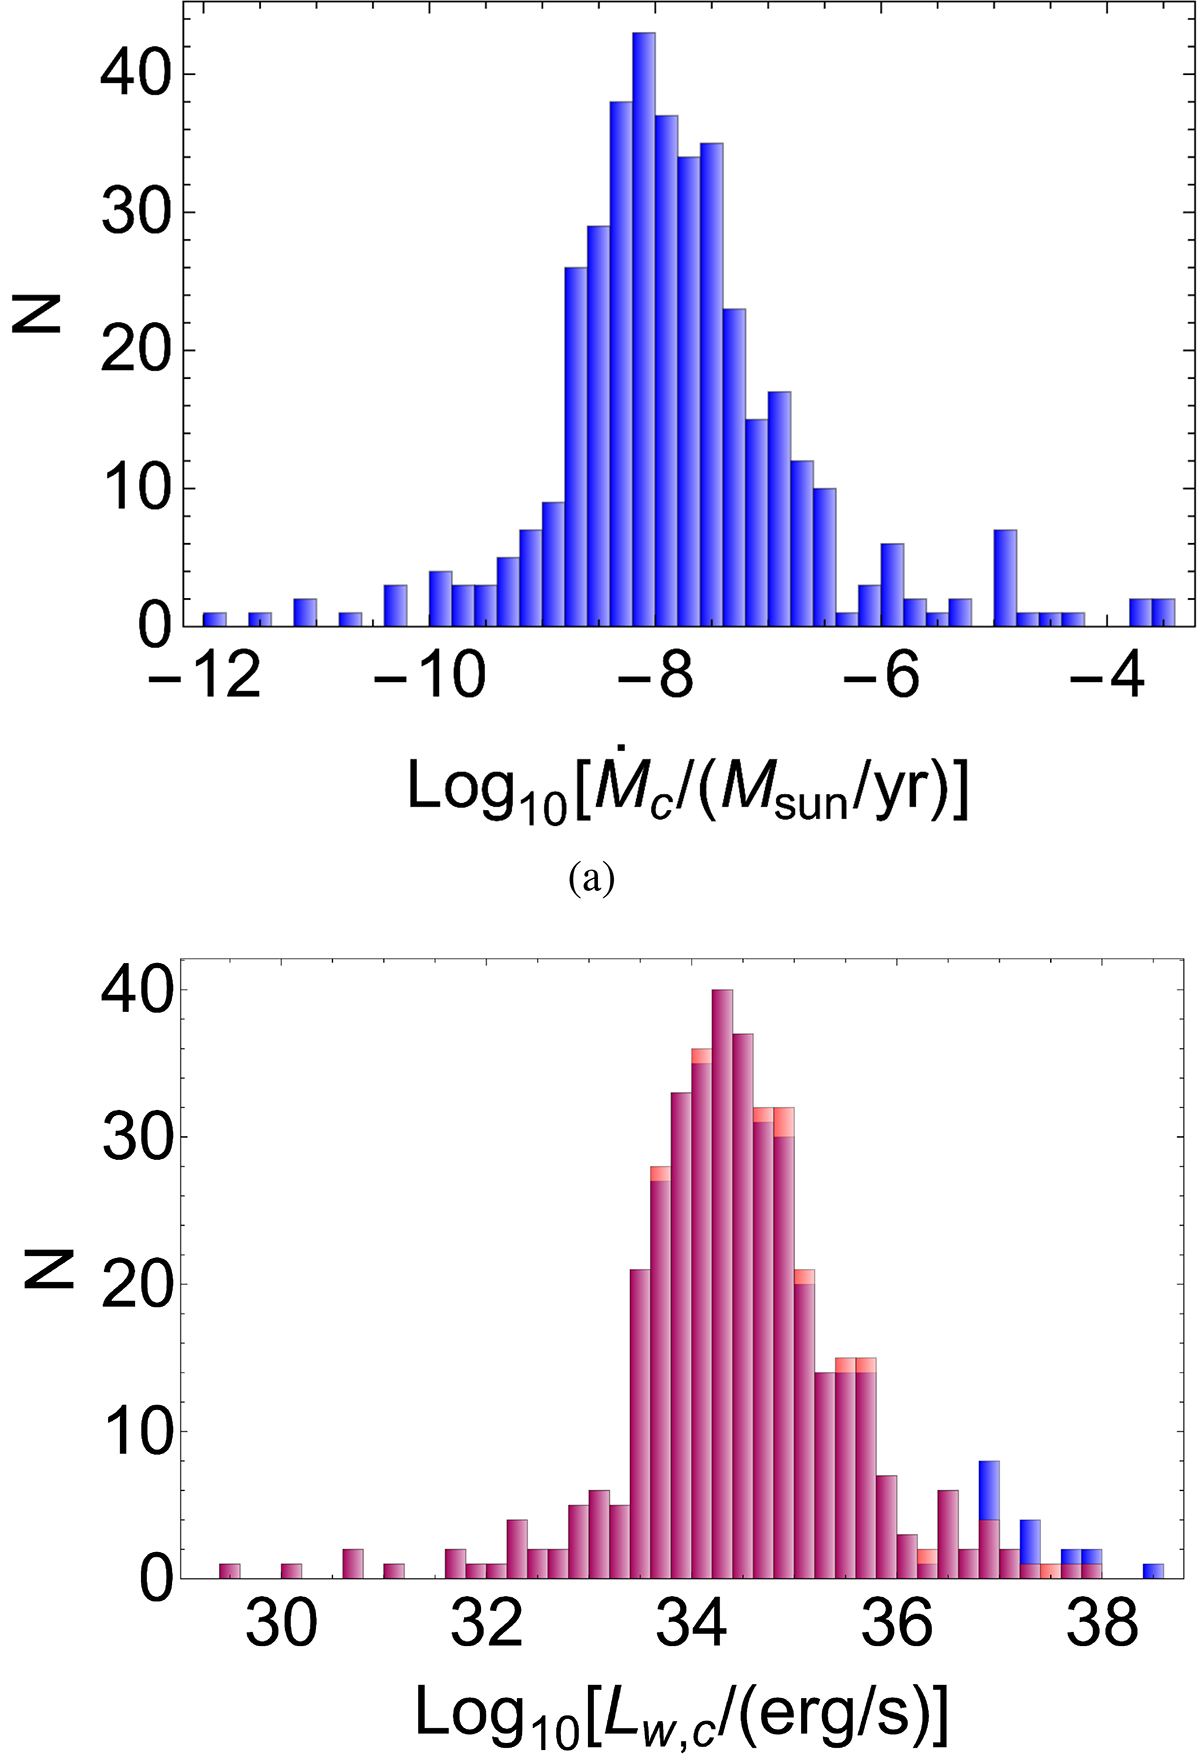
Distribution of the cluster mass-loss rates (panel a) in units of solar masses per year and of the wind luminosity (panel b) in units of erg s−1 for the selected young clusters. The latter shows the cluster wind luminosity computed both with (blue) and without (red) the contribution of observed WRs. The shaded part of the histogram represents overlapping values.
Current usage metrics show cumulative count of Article Views (full-text article views including HTML views, PDF and ePub downloads, according to the available data) and Abstracts Views on Vision4Press platform.
Data correspond to usage on the plateform after 2015. The current usage metrics is available 48-96 hours after online publication and is updated daily on week days.
Initial download of the metrics may take a while.