Fig. 6.
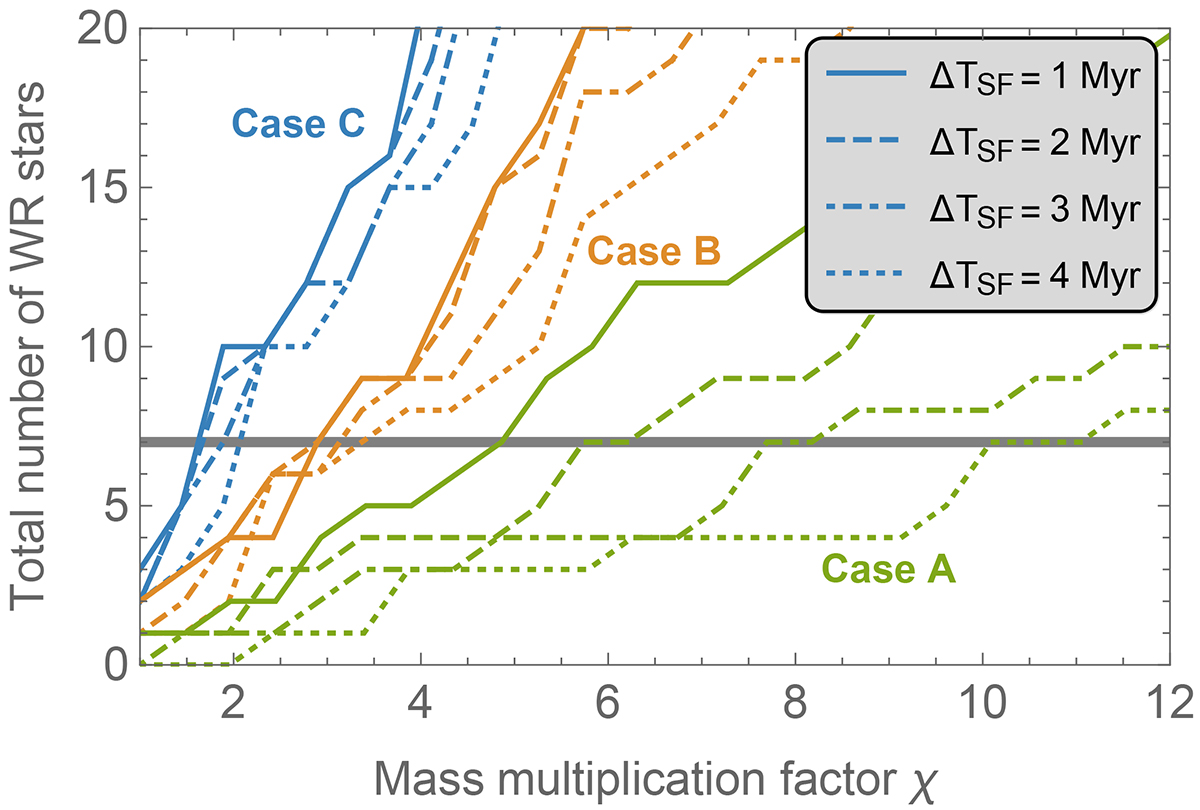
Download original image
Comparison of the observed number of WR stars in our cluster sample and the theoretical predictions where the cluster mass is multiplied by an arbitrary factor. The different line styles refer to different values of the duration of the star formation process, as indicated in the legend, and for three different cases: A (green), B (orange), and C (blue). The horizontal line corresponds to the number of observed WRs in the cluster sample, restricted to systems closer than 2.5 kpc, where both the Gaia and WR catalogs are assumed to be complete. See text for details.
Current usage metrics show cumulative count of Article Views (full-text article views including HTML views, PDF and ePub downloads, according to the available data) and Abstracts Views on Vision4Press platform.
Data correspond to usage on the plateform after 2015. The current usage metrics is available 48-96 hours after online publication and is updated daily on week days.
Initial download of the metrics may take a while.