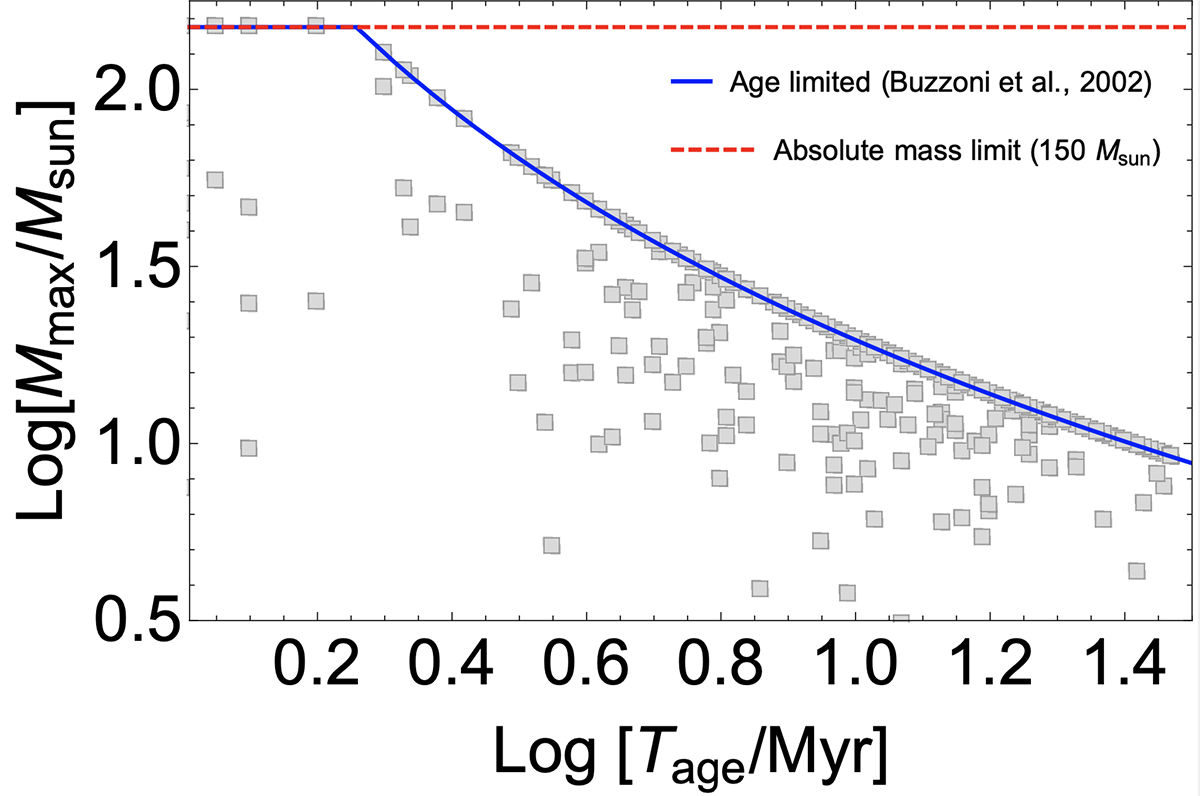
Fig. 2.
Download original image
Maximum expected stellar mass as a function of cluster age. The gray markers refer to the sample of selected young clusters from the Gaia catalog, whose maximum masses are evaluated from the iterative procedure described in the text. The solid blue line shows the result from Eq. (8), and the dashed red line represents the highest stellar mass value observed in the Milky Way at ≃150 M⊙.
Current usage metrics show cumulative count of Article Views (full-text article views including HTML views, PDF and ePub downloads, according to the available data) and Abstracts Views on Vision4Press platform.
Data correspond to usage on the plateform after 2015. The current usage metrics is available 48-96 hours after online publication and is updated daily on week days.
Initial download of the metrics may take a while.