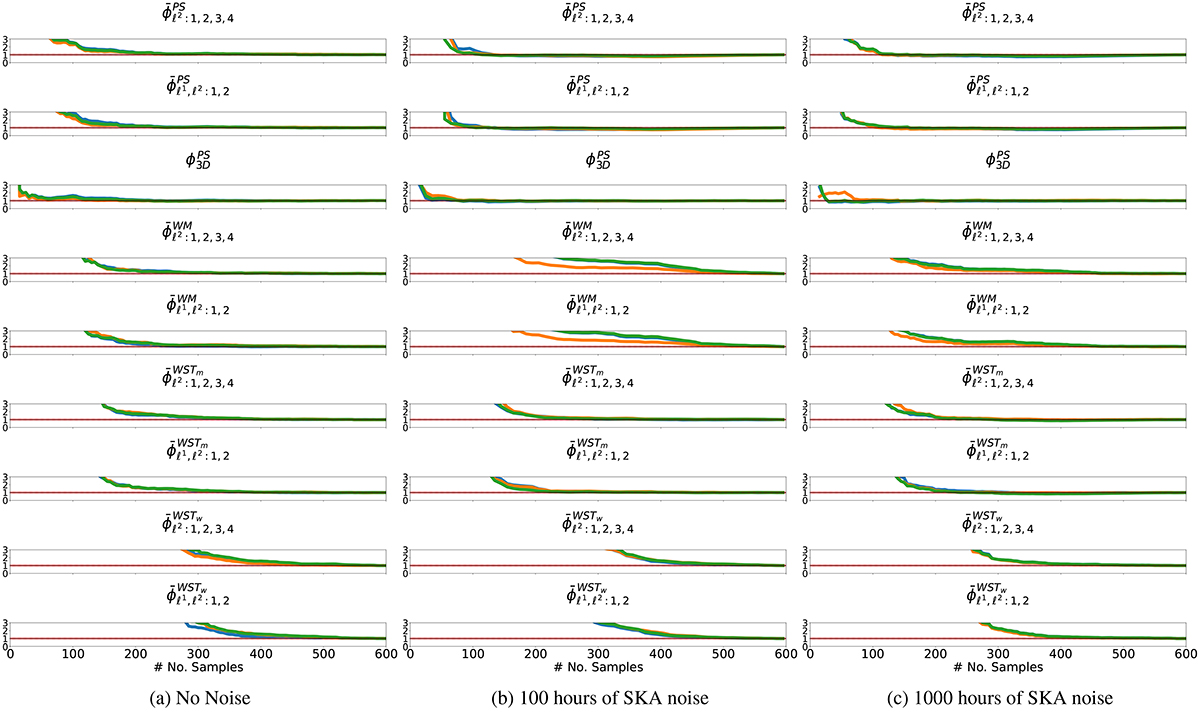
Fig. A.1.
Download original image
Convergence plots using equation (25), where we have kept the number of simulations used for our derivatives constant at 400 and are solely varying the number of fiducial simulations used for the covariance. We consider the different noise cases: (a) no noise, (b) 100 hours of SKA noise, and (c) 1000 hours of SKA noise. We see that by 200 samples all of our statistics are fully convergent, falling within the 10%, shown as the red shaded region.
Current usage metrics show cumulative count of Article Views (full-text article views including HTML views, PDF and ePub downloads, according to the available data) and Abstracts Views on Vision4Press platform.
Data correspond to usage on the plateform after 2015. The current usage metrics is available 48-96 hours after online publication and is updated daily on week days.
Initial download of the metrics may take a while.