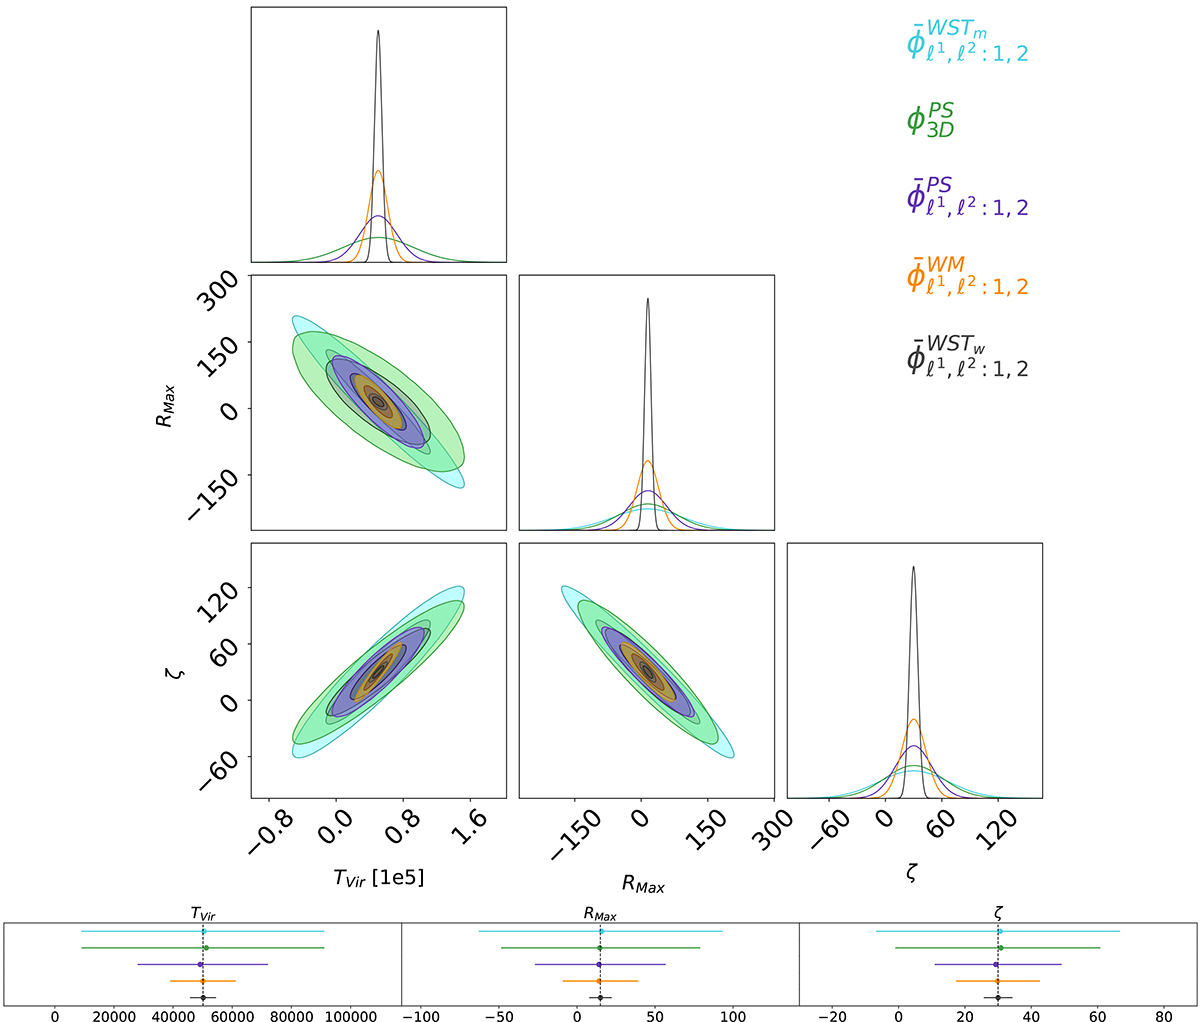
Fig. 5.
Download original image
As in Fig. 4, but for 100 h of SKA noise, where the noise is the dominant source of variance. We see now that WSTm is the statistic with the worst performance, and that WSTw, with its evolution along the lightcone summarised by the ℓ1-norm and ℓ2-norm on scales jz = 1, 2, which utilises wavelets derived from the power spectra binning, provides the tightest contours.
Current usage metrics show cumulative count of Article Views (full-text article views including HTML views, PDF and ePub downloads, according to the available data) and Abstracts Views on Vision4Press platform.
Data correspond to usage on the plateform after 2015. The current usage metrics is available 48-96 hours after online publication and is updated daily on week days.
Initial download of the metrics may take a while.