Fig. 9.

Download original image
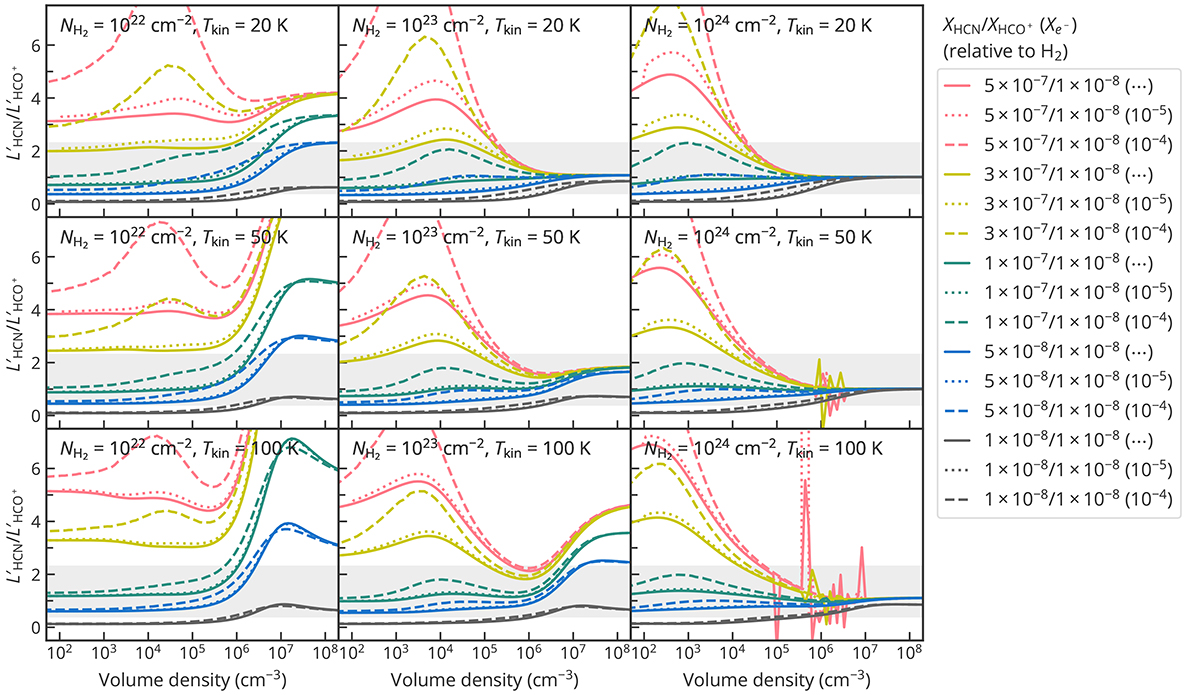
One-zone non-LTE calculation of ![]() as a function of H2 volume density. Gas kinetic temperatures of 20, 50, and 100 K and H2 column densities of 1022, 1023, and 1024 cm−2 were considered. The line width was fixed to be 50 km s−1 for all models. Different color curves represent various fractional abundances of HCN and HCO+ as indicated in the legend. Solid curves correspond to models without electron excitation, while dashed and dotted curves take into account excitation by electrons of different fractional abundances. Spikes seen in the lower right panels are caused by the population inversion of HCN. The gray shades indicate the range of 0.4−2.3, corresponding to the global
as a function of H2 volume density. Gas kinetic temperatures of 20, 50, and 100 K and H2 column densities of 1022, 1023, and 1024 cm−2 were considered. The line width was fixed to be 50 km s−1 for all models. Different color curves represent various fractional abundances of HCN and HCO+ as indicated in the legend. Solid curves correspond to models without electron excitation, while dashed and dotted curves take into account excitation by electrons of different fractional abundances. Spikes seen in the lower right panels are caused by the population inversion of HCN. The gray shades indicate the range of 0.4−2.3, corresponding to the global ![]() found in the sample galaxies. See Sect. 6.1 for details.
found in the sample galaxies. See Sect. 6.1 for details.
Current usage metrics show cumulative count of Article Views (full-text article views including HTML views, PDF and ePub downloads, according to the available data) and Abstracts Views on Vision4Press platform.
Data correspond to usage on the plateform after 2015. The current usage metrics is available 48-96 hours after online publication and is updated daily on week days.
Initial download of the metrics may take a while.


