Open Access
Fig. 5.
Download original image
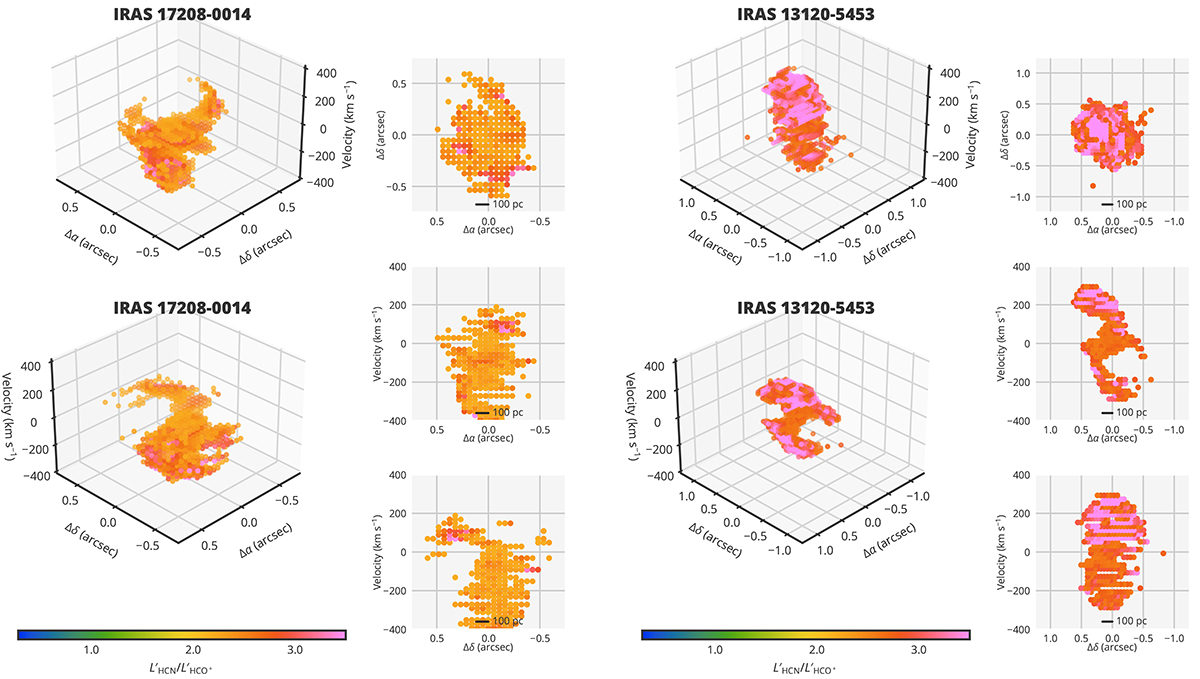
Visualizations of ![]() exceeding the 90th percentile (see Table 6) with projections onto the RA-Dec, RA-velocity, and Dec-velocity planes. The two 3D plots represent the same data from different angles. Displayed galaxies are IRAS 17208−0014 and IRAS 13120−5453.
exceeding the 90th percentile (see Table 6) with projections onto the RA-Dec, RA-velocity, and Dec-velocity planes. The two 3D plots represent the same data from different angles. Displayed galaxies are IRAS 17208−0014 and IRAS 13120−5453.
Current usage metrics show cumulative count of Article Views (full-text article views including HTML views, PDF and ePub downloads, according to the available data) and Abstracts Views on Vision4Press platform.
Data correspond to usage on the plateform after 2015. The current usage metrics is available 48-96 hours after online publication and is updated daily on week days.
Initial download of the metrics may take a while.