Fig. A.2.
Download original image
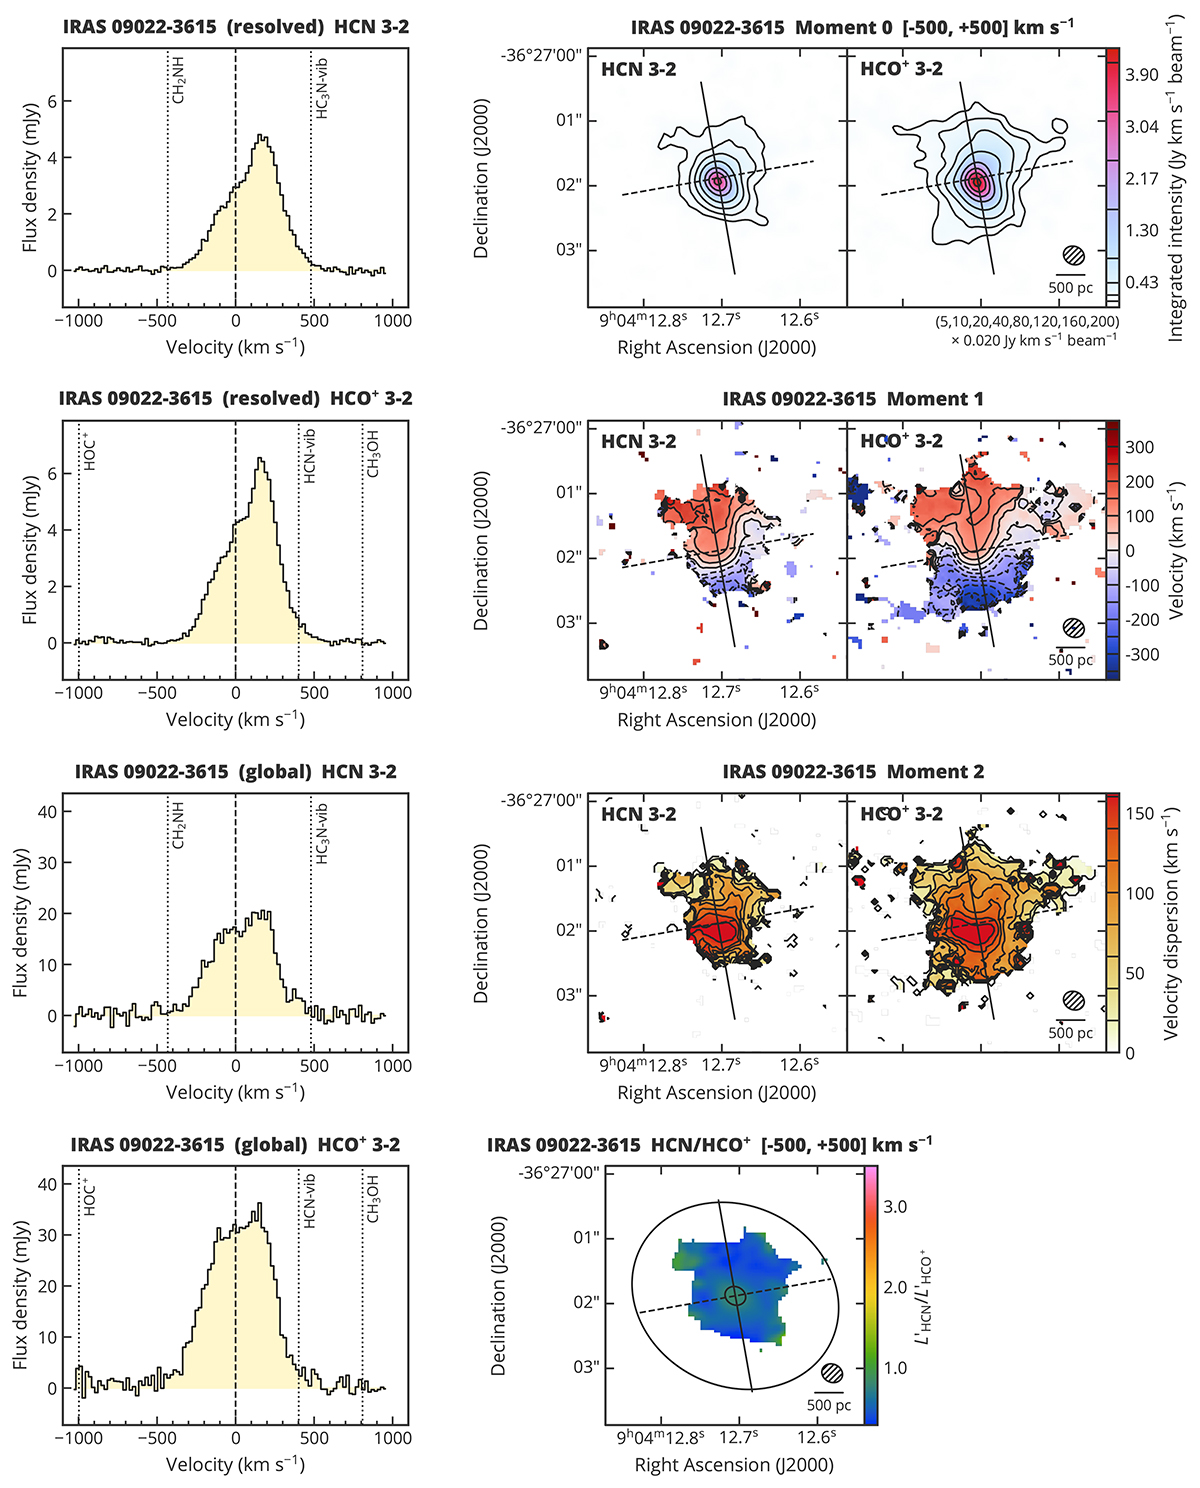
HCN 3–2 and HCO+ 3–2 for IRAS 09022−3615. Left panels: (Top two panels) Spectra extracted from the resolved aperture. (Lower two panels) Spectra extracted from the global aperture. Velocities are relative to the systemic velocity. The corresponding velocities of potentially detected species are indicated by vertical dotted lines. Right panels: (Top) Integrated intensity over ±500 km s−1 (moment 0). Contours are (5, 10, 20, 40, 80, 120, 160, 200) ×σ, where σ is 0.020 Jy km s−1 beam−1. (Second from top) Velocity field (moment 1). Contours are in steps of ±50 km s−1. (Third from top) Velocity dispersion (moment 2). Contours are in steps of 20 km s−1. Moment 1 and 2 were derived with 3σ clipping. (Bottom) ![]() . Color scale is from 0.285 to 3.5. Overlaid ellipses represent the apertures used for spectral extraction. Solid and dashed lines represent the kinematic major and minor axes, respectively. The synthesized beam is indicated by hatched ellipses in the lower right corners.
. Color scale is from 0.285 to 3.5. Overlaid ellipses represent the apertures used for spectral extraction. Solid and dashed lines represent the kinematic major and minor axes, respectively. The synthesized beam is indicated by hatched ellipses in the lower right corners.
Current usage metrics show cumulative count of Article Views (full-text article views including HTML views, PDF and ePub downloads, according to the available data) and Abstracts Views on Vision4Press platform.
Data correspond to usage on the plateform after 2015. The current usage metrics is available 48-96 hours after online publication and is updated daily on week days.
Initial download of the metrics may take a while.