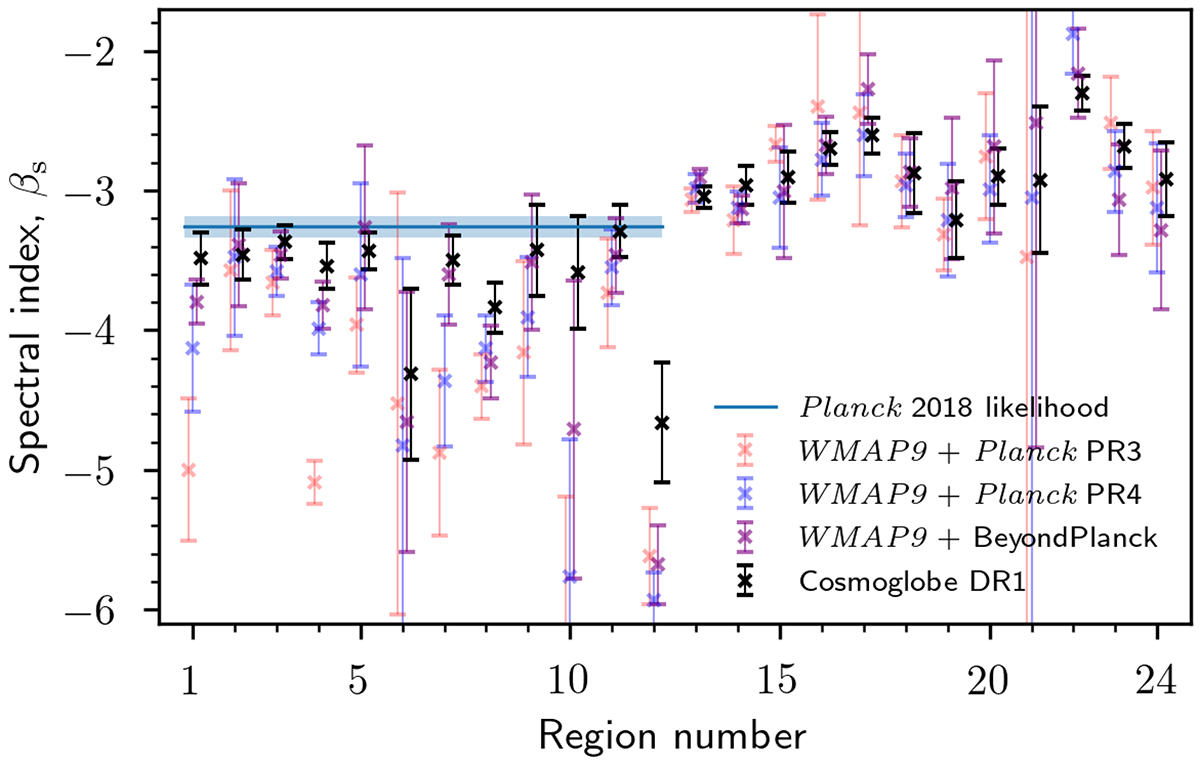
Fig. 9.
Download original image
Synchrotron spectral index as a function of region number, computed using T–T plots between the WMAP9 K-band and Planck PR3 30 GHz (red), WMAP9 K-band and Planck PR4 30 GHz (blue), WMAP9 K-band and BEYONDPLANCK 30 GHz (purple), and COSMOGLOBEK-band and COSMOGLOBE 30 GHz (black) maps. The spectral index is inverse variance weighted over rotation angles, and samples. The horizontal line in the high latitude regions corresponds to the estimated spectral index values from the Planck PR3 likelihood analysis (Planck Collaboration V 2020).
Current usage metrics show cumulative count of Article Views (full-text article views including HTML views, PDF and ePub downloads, according to the available data) and Abstracts Views on Vision4Press platform.
Data correspond to usage on the plateform after 2015. The current usage metrics is available 48-96 hours after online publication and is updated daily on week days.
Initial download of the metrics may take a while.