Fig. 6.
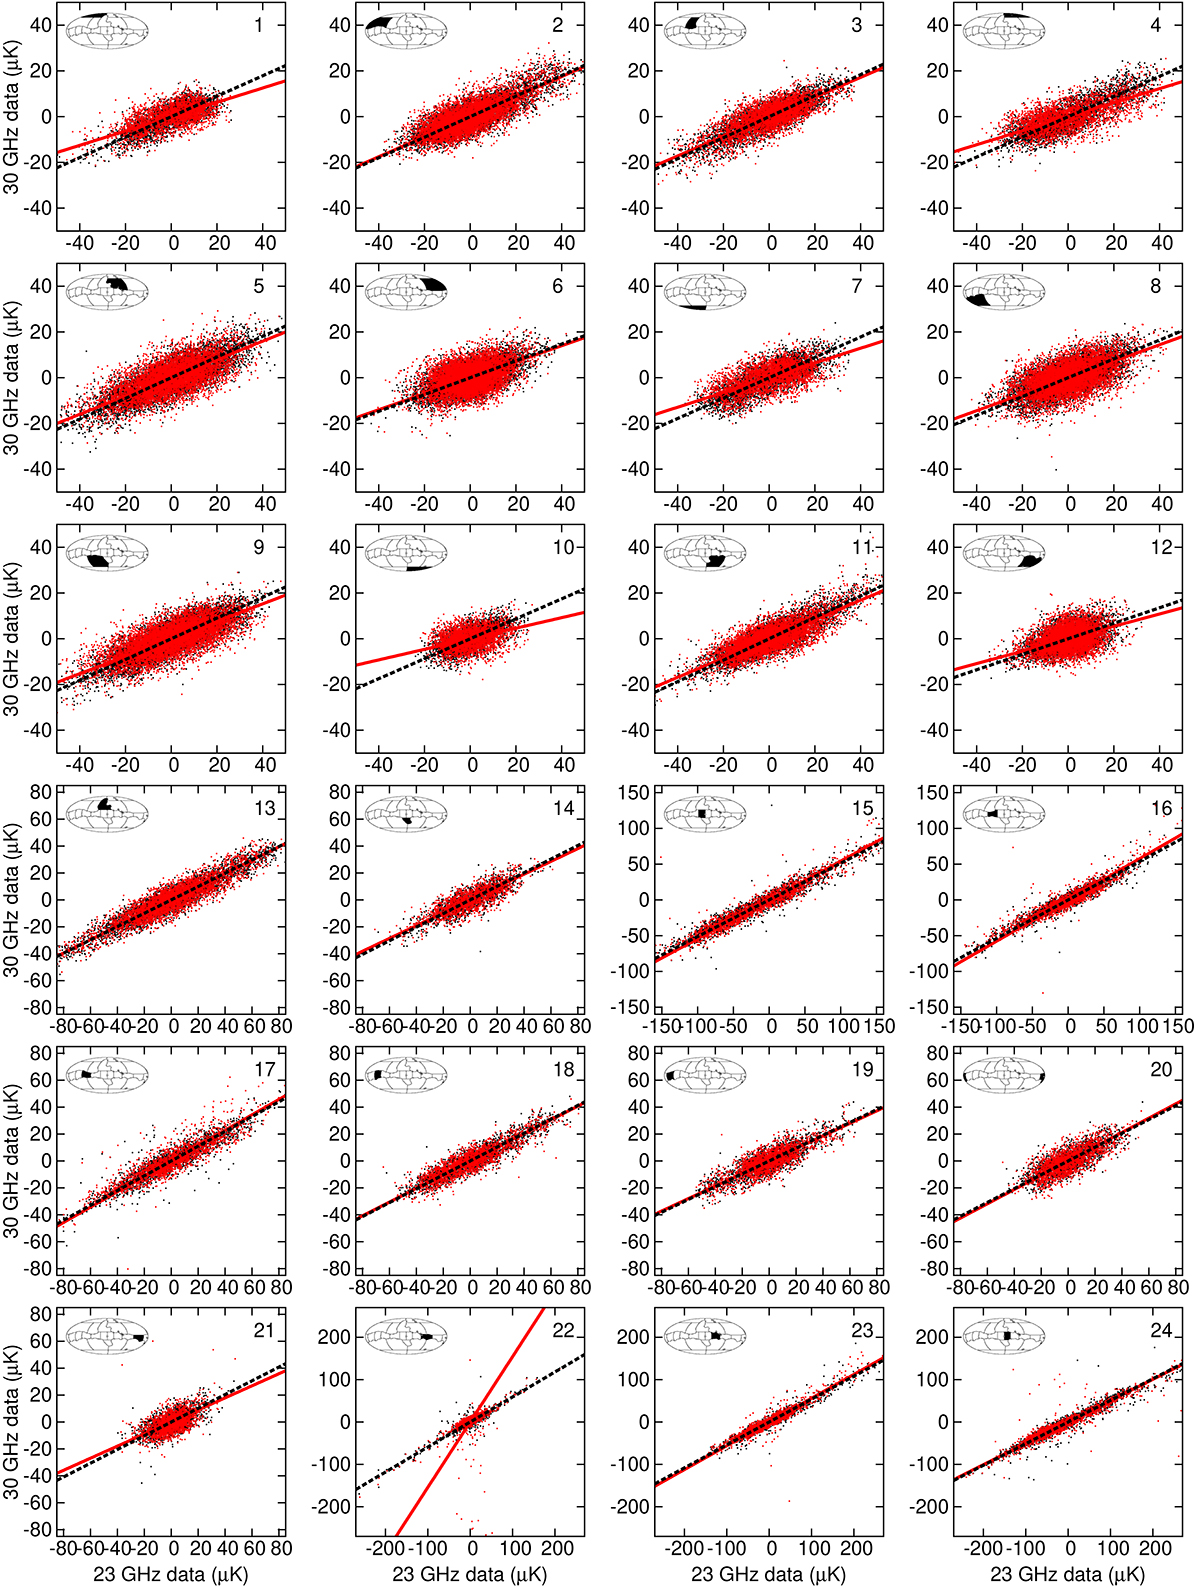
Download original image
T–T plots for Stokes Q and U maps of the COSMOGLOBE DR1 K- band versus the COSMOGLOBE DR1 30 GHz (black) and the WMAP9 K- band versus Planck PR3 30 GHz pixels (red) for all regions. The horizontal (solid and dotted) lines indicate the corresponding inverse variance weighted values of the spectral index, averaged over rotation angle, and in the COSMOGLOBE case also weighted over samples. The corresponding βs values can be found in Fig. 8.
Current usage metrics show cumulative count of Article Views (full-text article views including HTML views, PDF and ePub downloads, according to the available data) and Abstracts Views on Vision4Press platform.
Data correspond to usage on the plateform after 2015. The current usage metrics is available 48-96 hours after online publication and is updated daily on week days.
Initial download of the metrics may take a while.