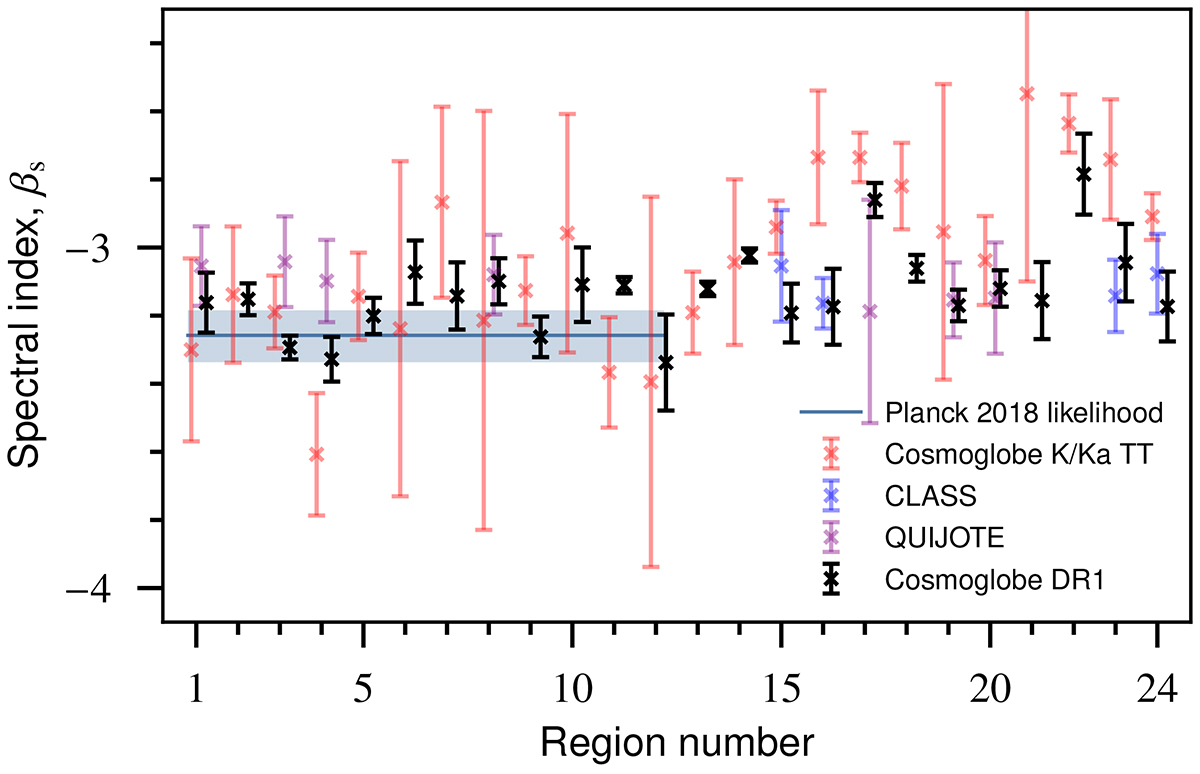
Fig. 13.
Download original image
Spectral index estimates from COSMOGLOBE using T–T plots with K and Ka maps and Gibbs sampling using all frequencies, and from QUIJOTE and CLASS using T–T plots. Only regions with ≥75% of the pixels within a given region are displayed. Red points and black points are both calculated using COSMOGLOBE frequency maps, but are obtained with different techniques.
Current usage metrics show cumulative count of Article Views (full-text article views including HTML views, PDF and ePub downloads, according to the available data) and Abstracts Views on Vision4Press platform.
Data correspond to usage on the plateform after 2015. The current usage metrics is available 48-96 hours after online publication and is updated daily on week days.
Initial download of the metrics may take a while.