Open Access
Fig. 12.
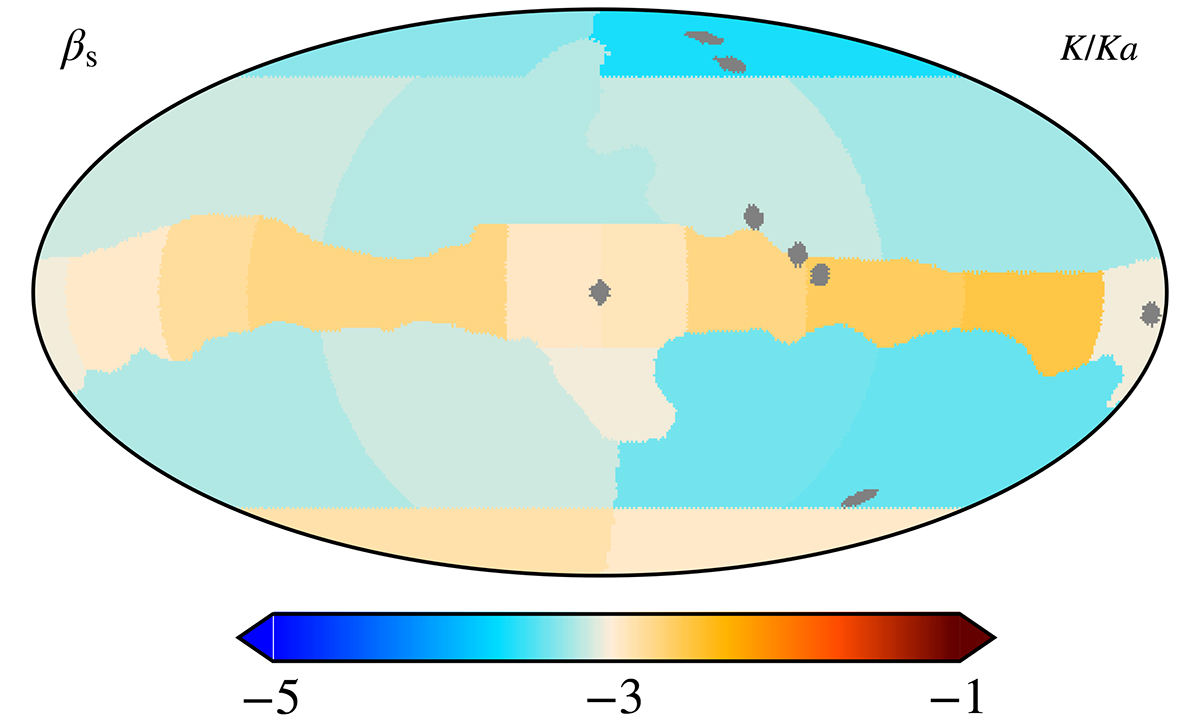
Download original image
Spatial variation in the synchrotron spectral index, computed using the T–T plot method between the COSMOGLOBE DR1 K- and Ka-band maps. The spectral index is inverse variance weighted over the rotation angle and samples.
Current usage metrics show cumulative count of Article Views (full-text article views including HTML views, PDF and ePub downloads, according to the available data) and Abstracts Views on Vision4Press platform.
Data correspond to usage on the plateform after 2015. The current usage metrics is available 48-96 hours after online publication and is updated daily on week days.
Initial download of the metrics may take a while.