Fig. 1.
Download original image
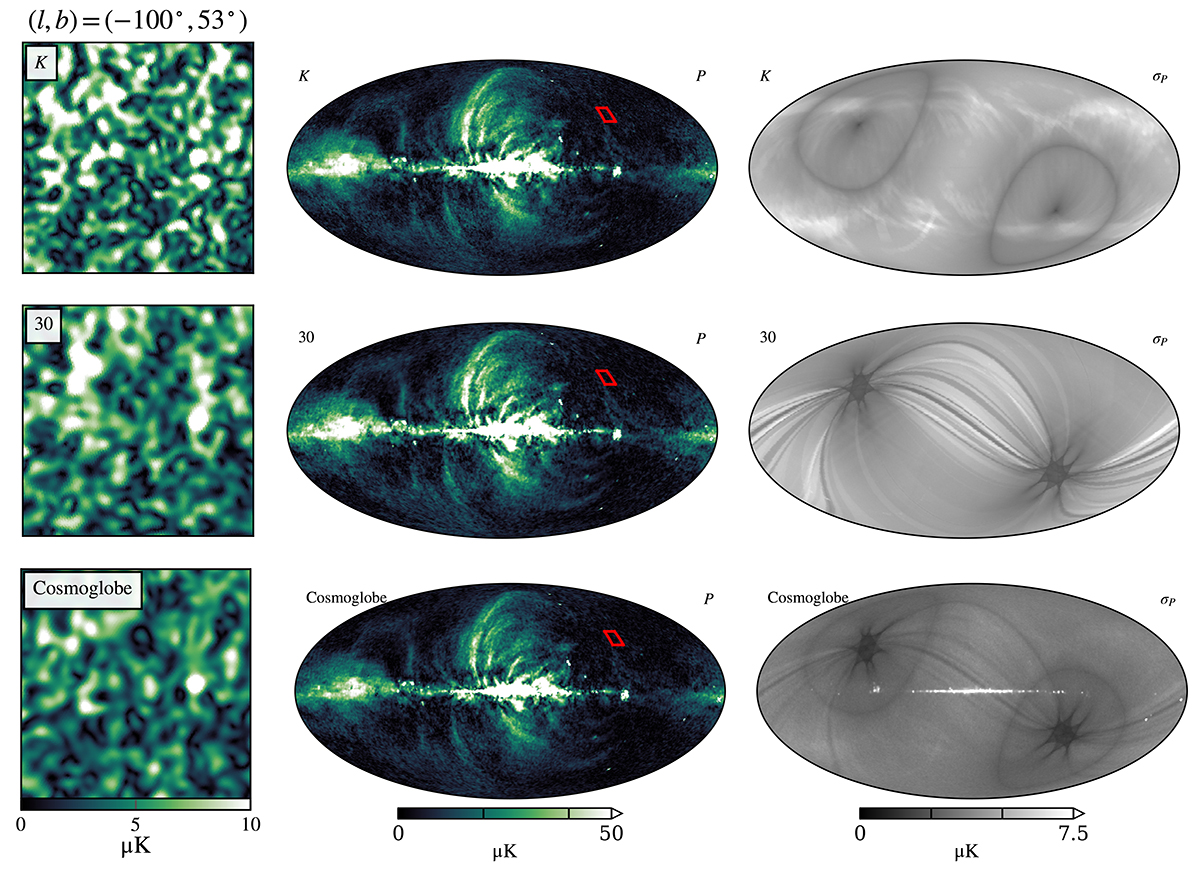
Polarized intensity and white noise levels of the WMAP K band (top), Planck 30 GHz band (middle), and synchrotron amplitude from the COSMOGLOBE Gibbs chain (bottom), all evaluated at 30 GHz with a resolution of 72′. All maps have been scaled to a common frequency of 30 GHz. The leftmost column is a 10° wide square centered on the low signal-to-noise region highlighted by a red square in the middle column’s panels. The middle column shows the polarized total amplitude, P. The rightmost column shows the rms noise for the K-band and 30 GHz frequency maps and the COSMOGLOBE DR1 synchrotron amplitude map.
Current usage metrics show cumulative count of Article Views (full-text article views including HTML views, PDF and ePub downloads, according to the available data) and Abstracts Views on Vision4Press platform.
Data correspond to usage on the plateform after 2015. The current usage metrics is available 48-96 hours after online publication and is updated daily on week days.
Initial download of the metrics may take a while.