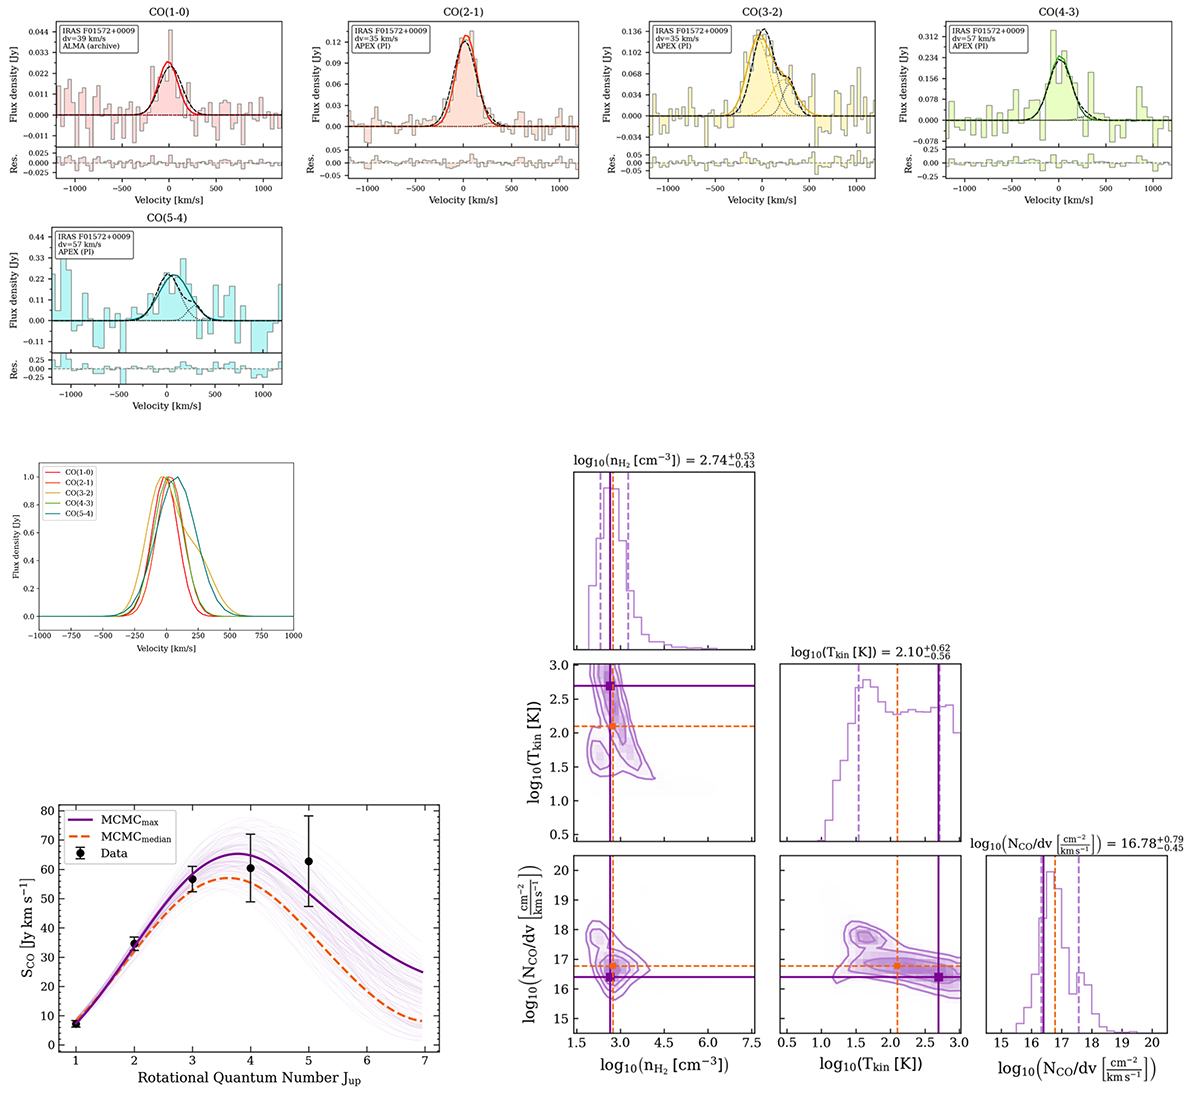
Fig. B.1.
Download original image
Top two rows: Integrated and continuum-subtracted CO emission lines for galaxy IRAS F01572+0009. The spectral binning and telescope are reported on the top-left corner of each spectrum. The multi-Gaussian fit performed individually for each spectral line, is shown in corresponding colors to each CO transition (in a solid line is the total, and the individual components are shown in dashed lines). For the higher-excitation ULIRGs, the simultaneous multi-Gaussian fit is also overplotted on each spectrum in dark gray color (in a dashed line is the total, and the individual components are shown in dotted lines). Bottom panels: On the top left are all the available spectral line profiles (fitted with multi-Gaussian profiles) normalized to their maximum value plotted together. This allows for better visualizing the variations in line widths for different CO rotational lines. On the bottom left is the CO SLED fitted with one gas component, where the maximum posterior probability is shown in a purple solid line, while the median value of the marginal probability distribution is shown with an orange dashed line. On the bottom right panel, and with the same colors, are the posterior probability distributions of the molecular gas density (nH2), gas temperature (Tkin) and CO column density per velocity (NCO/dv) parameters for the single and two-component fit.
Current usage metrics show cumulative count of Article Views (full-text article views including HTML views, PDF and ePub downloads, according to the available data) and Abstracts Views on Vision4Press platform.
Data correspond to usage on the plateform after 2015. The current usage metrics is available 48-96 hours after online publication and is updated daily on week days.
Initial download of the metrics may take a while.