Fig. 8
Download original image
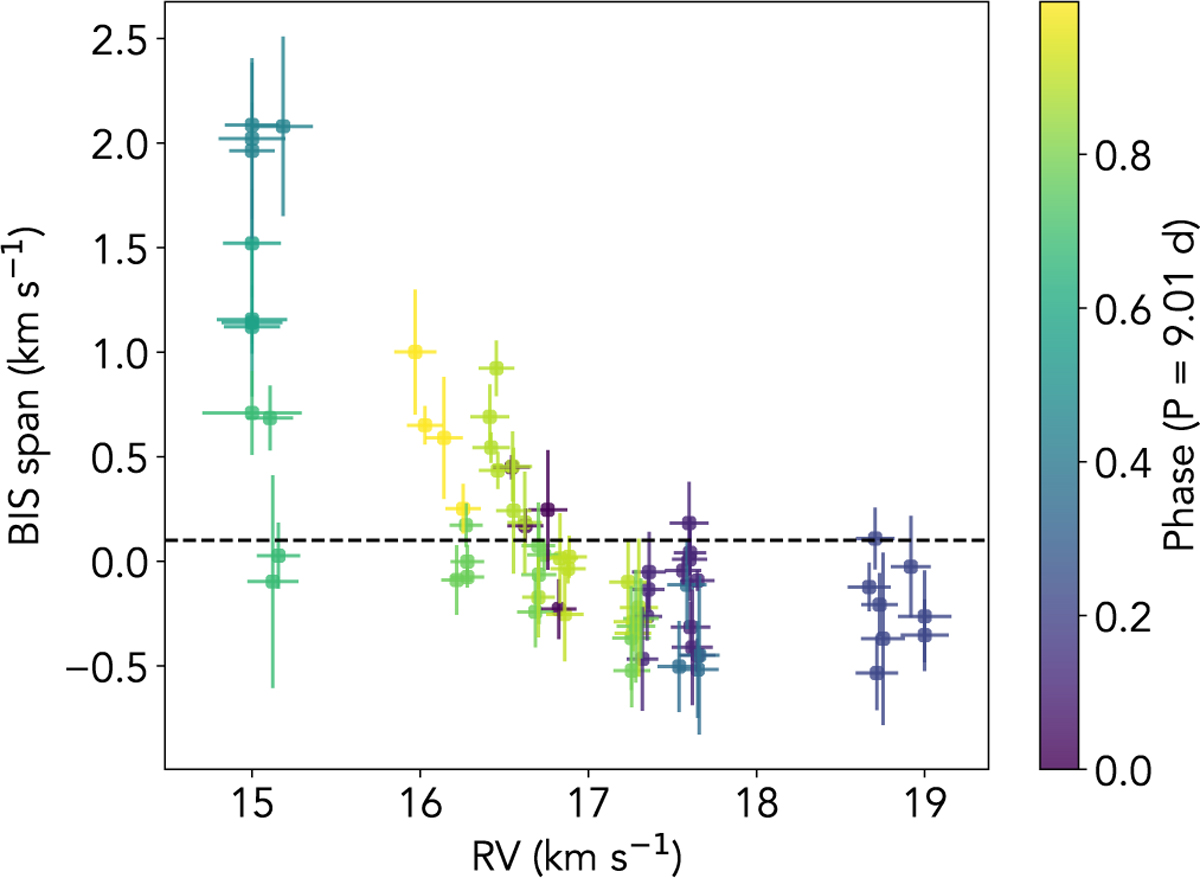
Bisector span of the mean LSD profiles from ESPaDOnS spectra. A correlation is seen at lower velocities up to around 17 km s−1 and then no correlation where it reaches a plateau. The data points are colour-coded based on phase of the 9.01 d spot rotation period. The dashed line indicates the threshold below which BIS span values were selected to compute the L1 periodogram shown in red in Fig. 9.
Current usage metrics show cumulative count of Article Views (full-text article views including HTML views, PDF and ePub downloads, according to the available data) and Abstracts Views on Vision4Press platform.
Data correspond to usage on the plateform after 2015. The current usage metrics is available 48-96 hours after online publication and is updated daily on week days.
Initial download of the metrics may take a while.