Fig. 3
Download original image
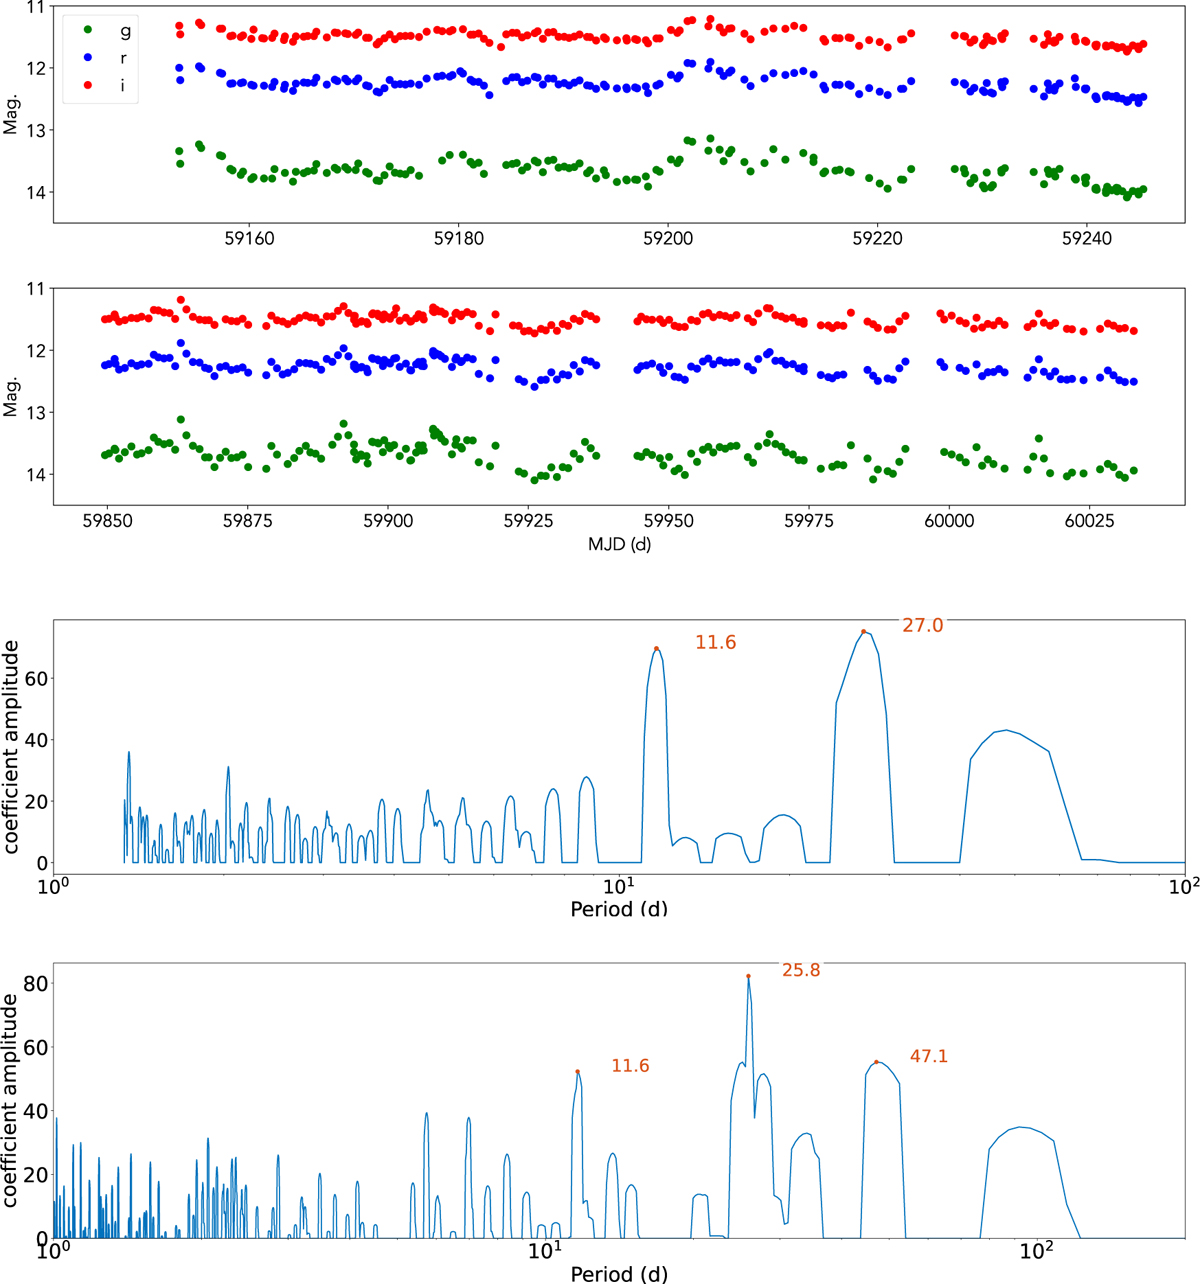
LCOGT light curves and L1 periogogram for each band, 𝑔 (green), r (blue), and i (red). Top panel: first semester (20B) light curve observed between 31 October 2020 and 08 January 2021. Second from top panel: second semester light curve taken between 27 September 2022 and 31 March 2023. Third from top panel: L1 periodogram of the combined dataset for semester 20B. Bottom panel: L1 periodogram of the combined dataset for semester 22B/23A.
Current usage metrics show cumulative count of Article Views (full-text article views including HTML views, PDF and ePub downloads, according to the available data) and Abstracts Views on Vision4Press platform.
Data correspond to usage on the plateform after 2015. The current usage metrics is available 48-96 hours after online publication and is updated daily on week days.
Initial download of the metrics may take a while.