Fig. 16
Download original image
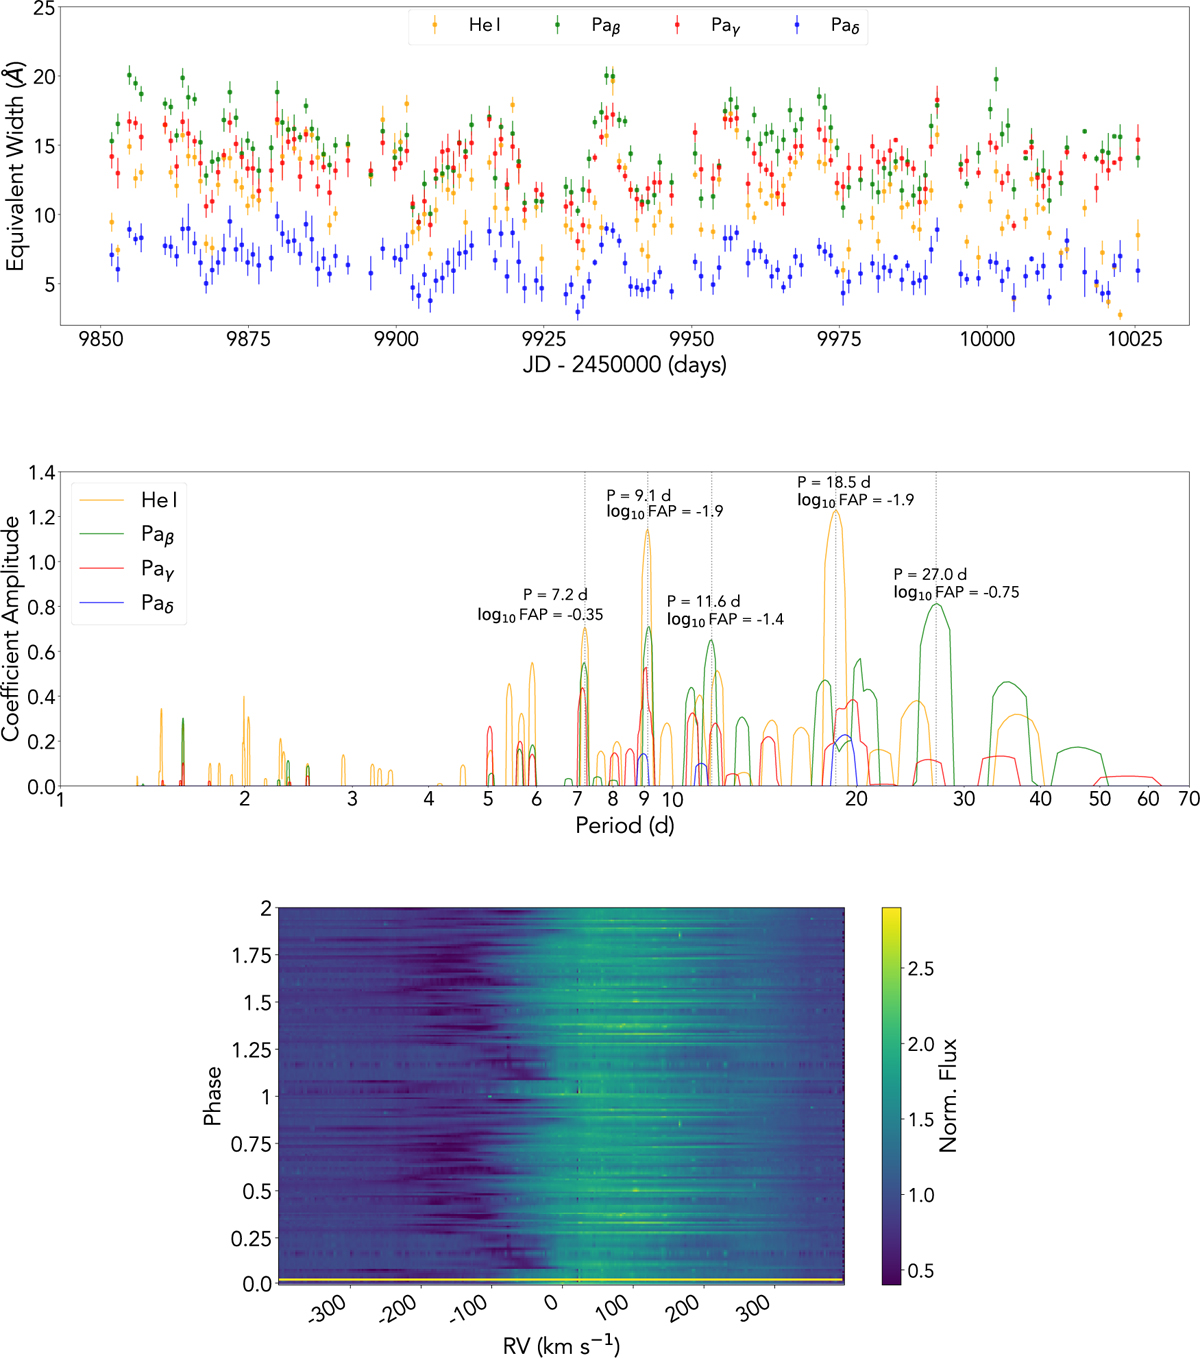
L1 periodogram analysis of LCOGT light curves and trailed plot of He I line. Top: time series of EW measured for He I, Paβ, Paγ, and Paδ lines. Middle: L1 periodogram of EW. A clear peak is detected in the strongest line tracing accretion (Paβ) at ~27.0 d. Additional peaks that are relatively significant are seen at 7.2 d, 9.1 d (spot), 11.6 d, 18.5 d (see text). Bottom: trailed plot of the He I line phased at a period of 19.5 d showing high-velocity outflows traced by the blue absorption component in the line. The colour bar represents the normalised flux.
Current usage metrics show cumulative count of Article Views (full-text article views including HTML views, PDF and ePub downloads, according to the available data) and Abstracts Views on Vision4Press platform.
Data correspond to usage on the plateform after 2015. The current usage metrics is available 48-96 hours after online publication and is updated daily on week days.
Initial download of the metrics may take a while.