Fig. 14
Download original image
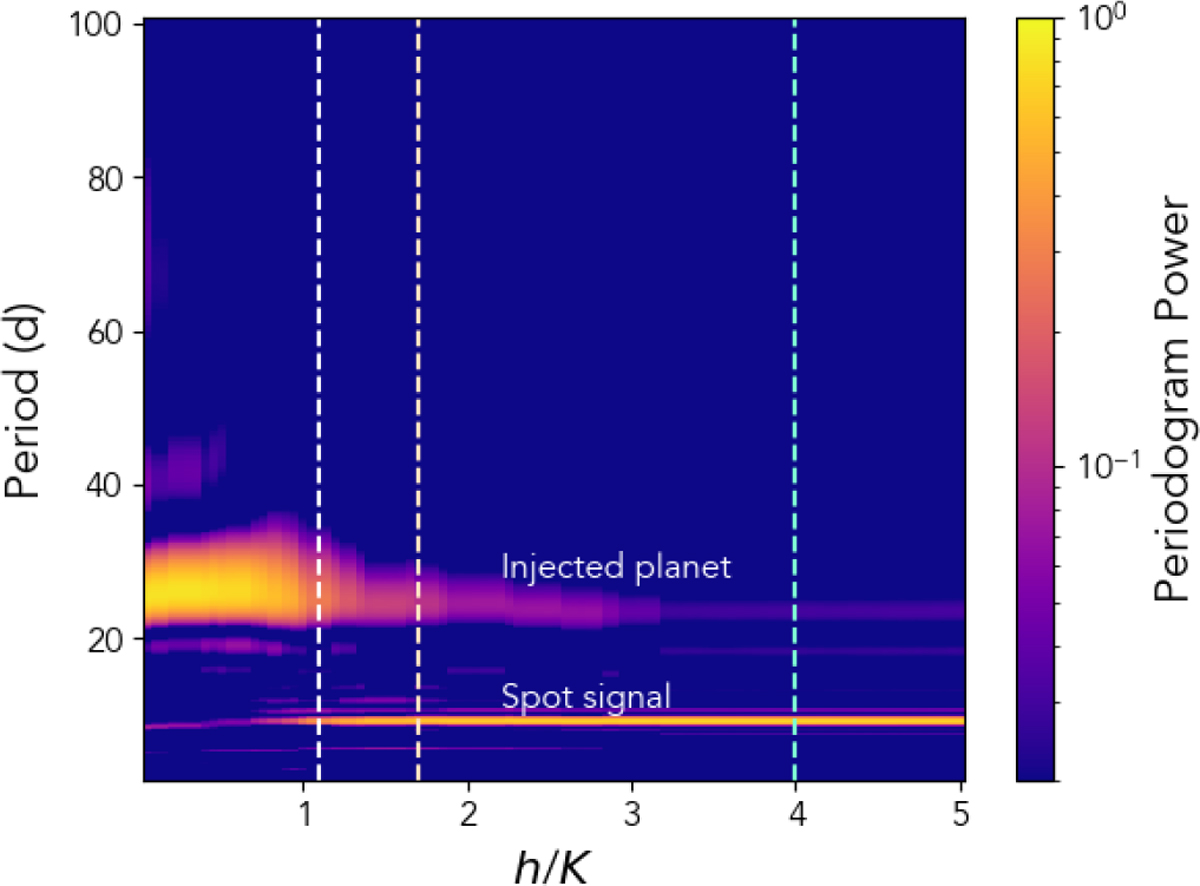
2D periodogram of simulated RVs to show the peak detection limits of an injected planet at 25.2 d period in the presence of spot modulation at 9 d. The value of h/K derived for CI Tau is shown with the white dashed line at 1.1. The cyan line shows the detection limit in the optical where we expect the activity RV signals to be ~ four times larger. The light orange dashed line at 1.7 depicts the h/K expected in the H band.
Current usage metrics show cumulative count of Article Views (full-text article views including HTML views, PDF and ePub downloads, according to the available data) and Abstracts Views on Vision4Press platform.
Data correspond to usage on the plateform after 2015. The current usage metrics is available 48-96 hours after online publication and is updated daily on week days.
Initial download of the metrics may take a while.