Fig. 12
Download original image
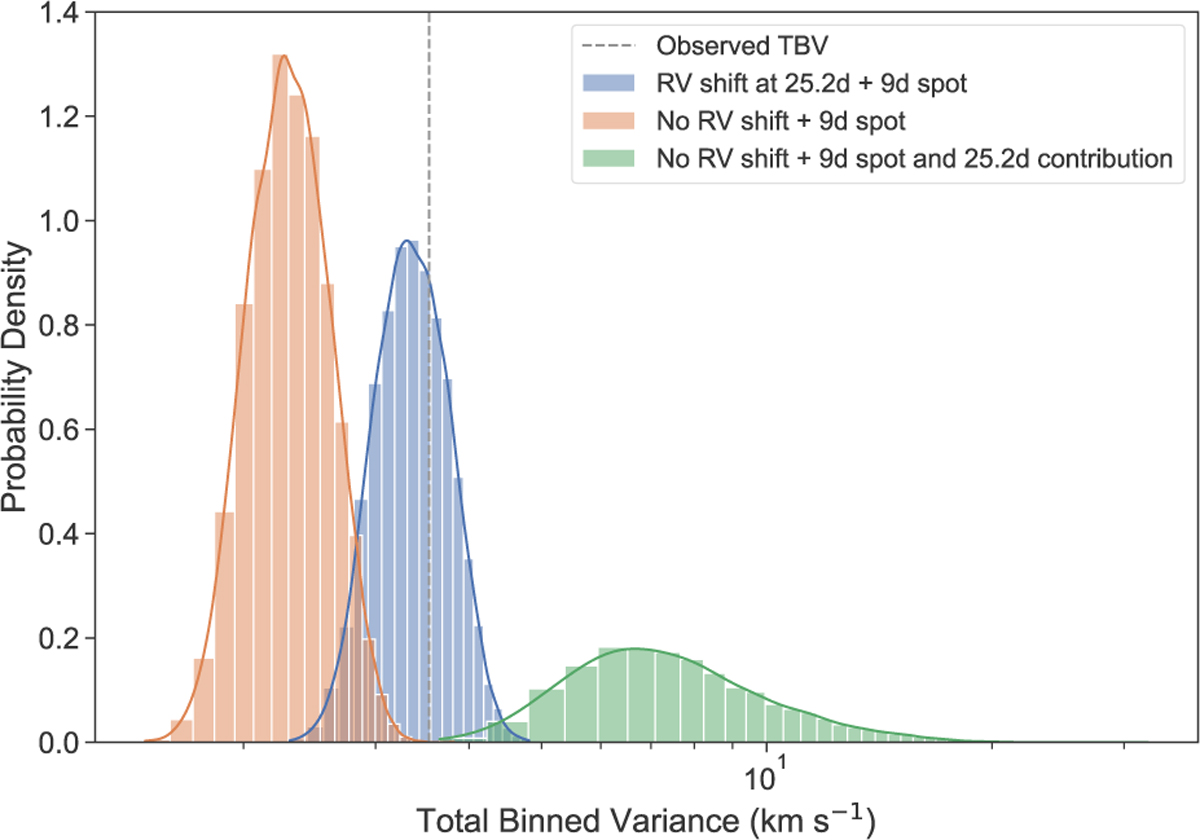
TBV vs. probability density after 10 000 MC simulations for three cases. In case 1 (orange) the star is at rest and the spot modulated at 9 d; in case 2 (blue) the star is Doppler shifted with a semi-amplitude of 0.3 km s−1, keeping all other parameters the same as in case 1. In case 3 (green) we test a scenario proposed by Donati et al. (2024), i.e. a contribution from material in the inner disk on the CO lines, that could cause the 25.2 d periodicity. The distributions represent the TBVs of the BIS span plots. The grey dotted line is the observed TBV for the SPIRou BIS span vs. RVs plot.
Current usage metrics show cumulative count of Article Views (full-text article views including HTML views, PDF and ePub downloads, according to the available data) and Abstracts Views on Vision4Press platform.
Data correspond to usage on the plateform after 2015. The current usage metrics is available 48-96 hours after online publication and is updated daily on week days.
Initial download of the metrics may take a while.