Fig. 1
Download original image
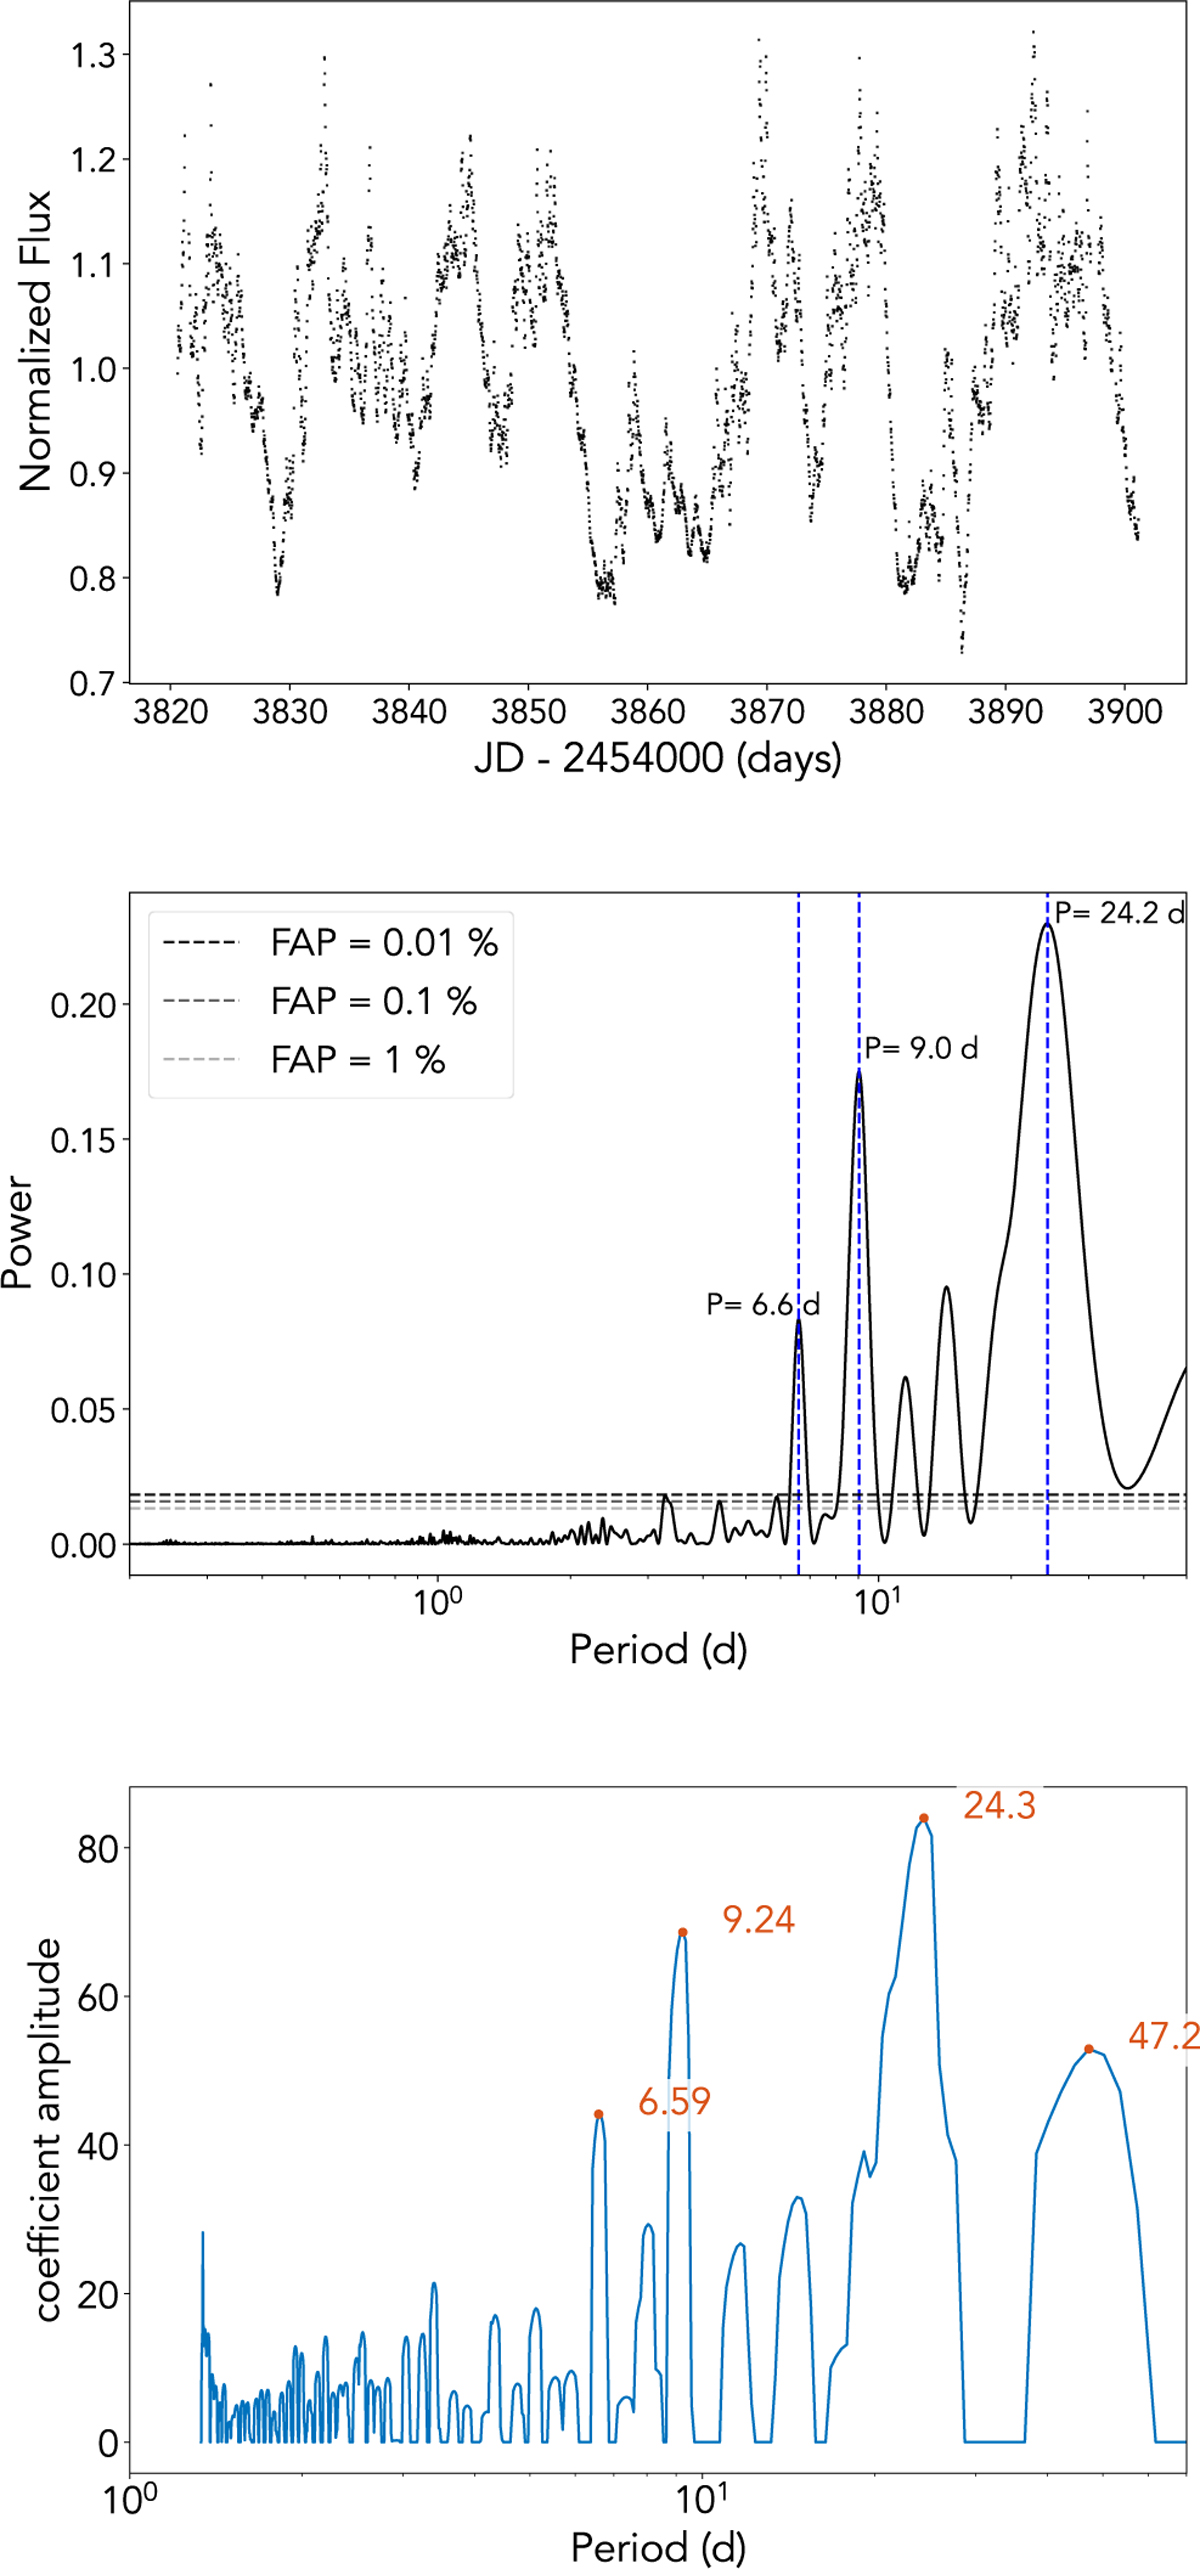
Light curve, GLS and L1 periodograms for the K2 data. Top: K2 light curve of CI Tau. Middle: GLS periodogram of the K2 light curve, showing three peaks at 6.6, 9.0, and 24.2 d indicated with blue dashed lines. Bottom: L1 periodogram, showing the same periods as found in the GLS periodogram, with an additional significant peak at 47.2 d.
Current usage metrics show cumulative count of Article Views (full-text article views including HTML views, PDF and ePub downloads, according to the available data) and Abstracts Views on Vision4Press platform.
Data correspond to usage on the plateform after 2015. The current usage metrics is available 48-96 hours after online publication and is updated daily on week days.
Initial download of the metrics may take a while.