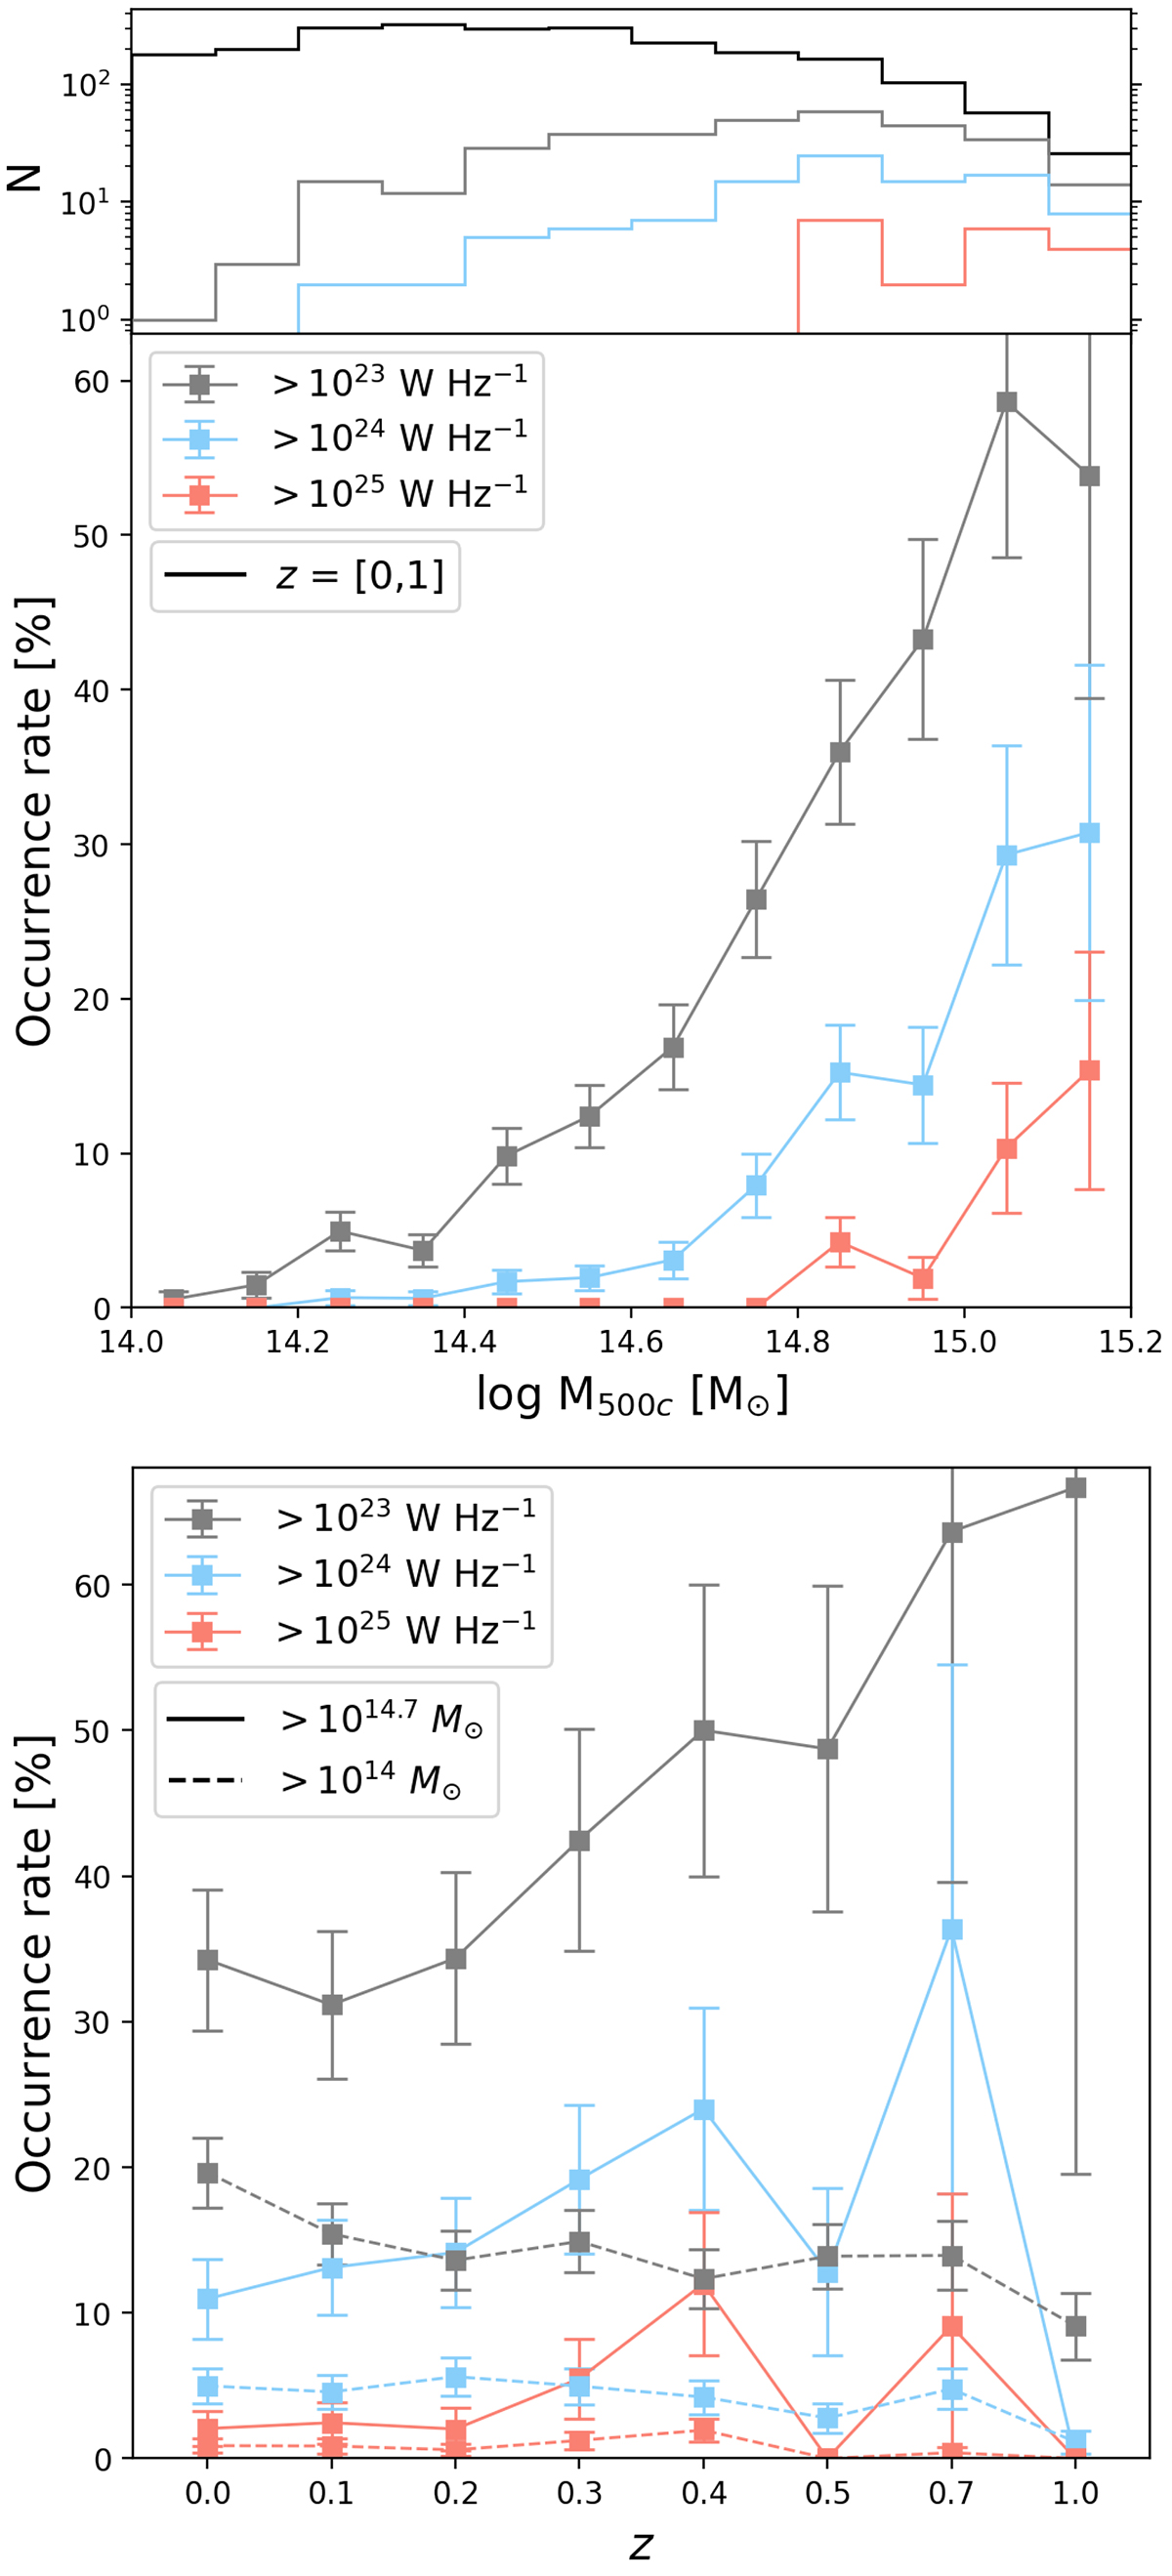
Fig. 7.
Download original image
Occurrence rate of radio relics according to TNG-Cluster as a function of primary cluster mass (top) and redshift (bottom). The data points are colored based on different luminosity cuts, and the error bar shows the Poisson noise. The top subplot quantifies the number of clusters in each mass bin (black histogram) and those hosting radio relics above a certain radio luminosity (colored histograms). The final bin includes the three clusters with M500c > 1015.2 M⊙. In the redshift distribution, the dotted and solid lines mark the clusters with M500c > 1014 M⊙ and M500c > 5 × 10¹⁴ M⊙, respectively. The fraction of clusters that host radio relics increases with the system’s mass, whereas the redshift dependence is less unclear.
Current usage metrics show cumulative count of Article Views (full-text article views including HTML views, PDF and ePub downloads, according to the available data) and Abstracts Views on Vision4Press platform.
Data correspond to usage on the plateform after 2015. The current usage metrics is available 48-96 hours after online publication and is updated daily on week days.
Initial download of the metrics may take a while.