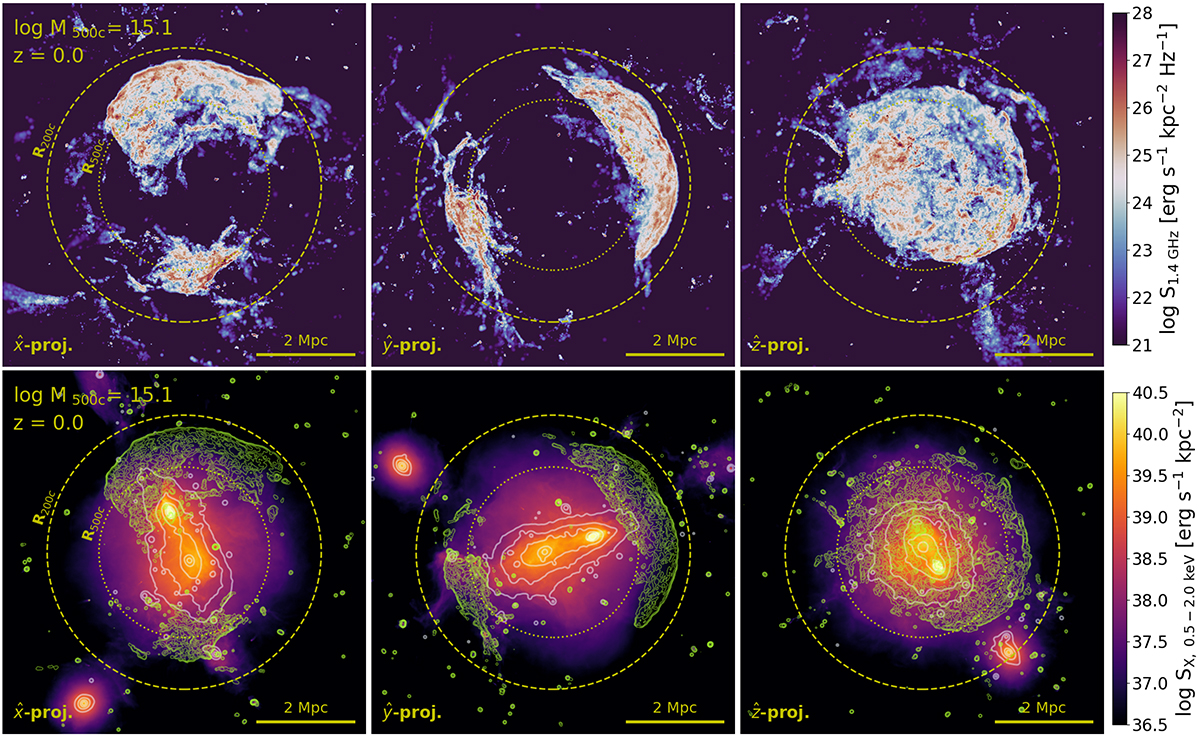
Fig. 4.

Download original image
Radio surface brightness map (top) and multiwavelength map (bottom) in three different projections of the same TNG-Cluster merging cluster as in Fig. 1. The yellow circles mark R500c (1.7 Mpc) and R200c (2.8 Mpc) from the cluster center. The green and white contours on the X-ray map depict radio surface brightness and mass surface density, smoothed with σ = 10 and 20 kpc Gaussian kernels and spaced equally in logscale in between [1024, 1027] erg s−1 Hz−1 kpc−2 and [108.3, 109.3] M⊙ kpc−2, respectively. The clearly visible double radio relics are elongated tangentially with respect to the mass center and their LLS measures ∼4 Mpc. Moreover, they form a nonuniform radio halo-like feature in the z-axis projection that fills the cluster volume to R500c. The total radio power of these structures is P1.4 GHz ∼ 1025 W Hz−1.
Current usage metrics show cumulative count of Article Views (full-text article views including HTML views, PDF and ePub downloads, according to the available data) and Abstracts Views on Vision4Press platform.
Data correspond to usage on the plateform after 2015. The current usage metrics is available 48-96 hours after online publication and is updated daily on week days.
Initial download of the metrics may take a while.


