Fig. 3.
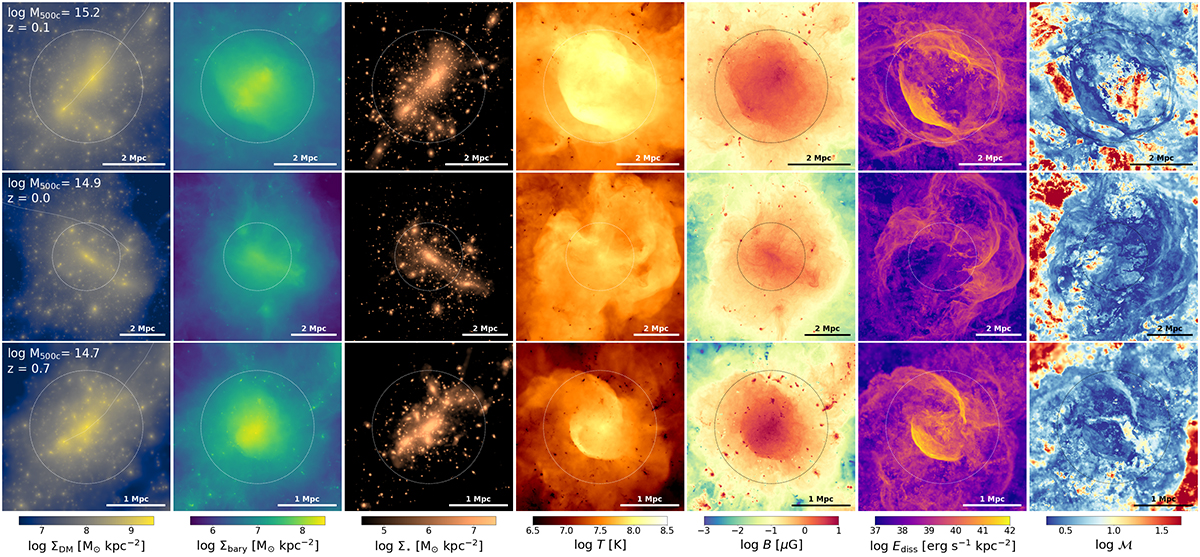
Download original image
Projection maps of the same quantities as in Fig. 1 of three mergers of the TNG-Cluster clusters with extreme merger properties. The considered depth is 20 Mpc. From top to bottom, we show (a) a high-velocity collision with ∼4300 km s−1, (b) an off-axis cluster merger with pericenter separation ∼1.8 Mpc, and (c) a high redshift (z = 0.7), massive (log M200c = 14.8) cluster merger. In all panels, the circles denote R500c; the white curve in the DM density maps marks the path of the colliding subcluster over the last ∼3 Gyr.
Current usage metrics show cumulative count of Article Views (full-text article views including HTML views, PDF and ePub downloads, according to the available data) and Abstracts Views on Vision4Press platform.
Data correspond to usage on the plateform after 2015. The current usage metrics is available 48-96 hours after online publication and is updated daily on week days.
Initial download of the metrics may take a while.