Fig. A.2.
Download original image
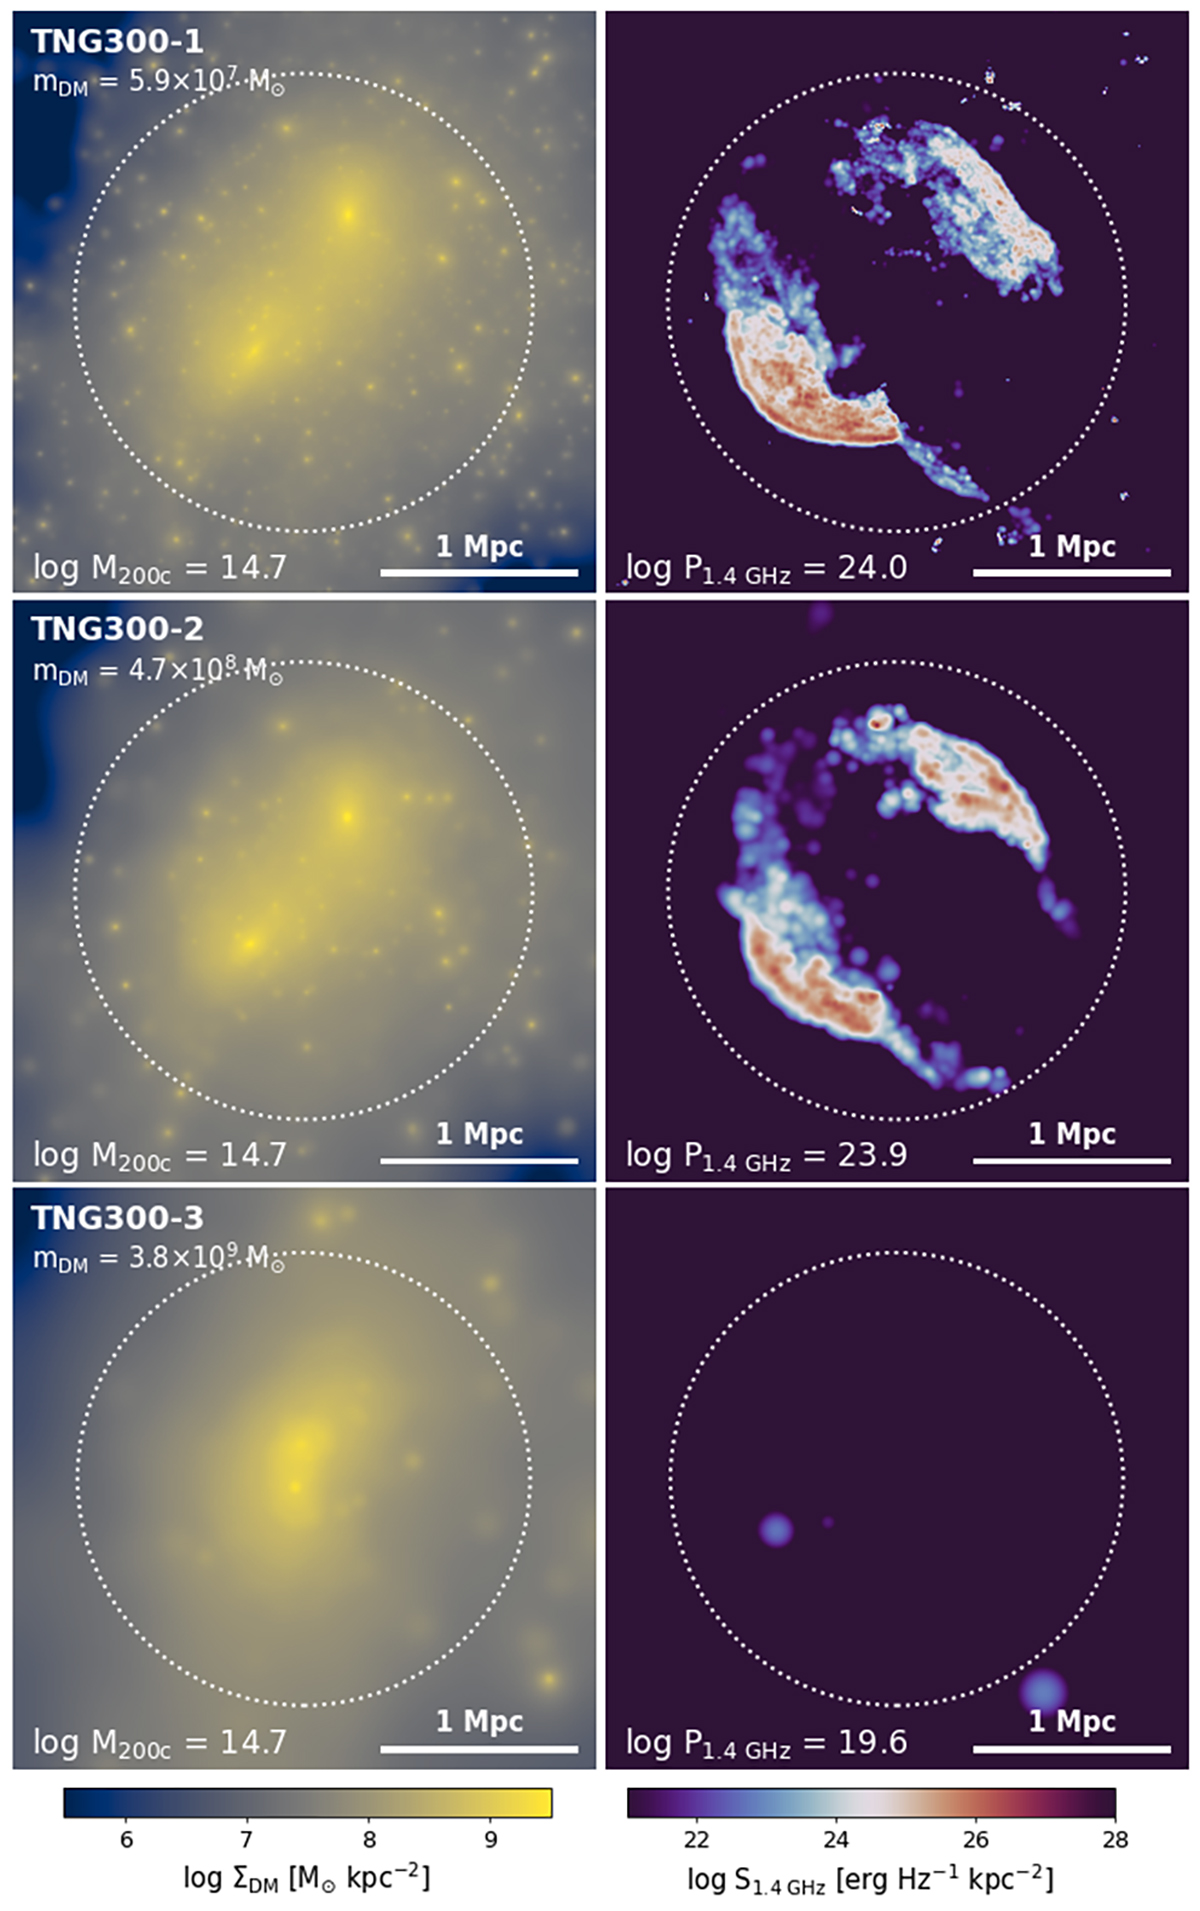
Projection map of mass (left) and radio surface brightness (right column) of the same cluster merger in the TNG300-1 (top), TNG300-2 (middle), and TNG300-3 run (bottom row). The figure is centered on the center of mass. The dotted circle marks the R500c. The annotated M200c and P1.4 GHz have the unit of M⊙ and W Hz−1, respectively. The radio relic morphology is consistent between the TNG300-2 and TNG300-1 runs, whereas the radio relics are not resolved in the TNG300-3 run.
Current usage metrics show cumulative count of Article Views (full-text article views including HTML views, PDF and ePub downloads, according to the available data) and Abstracts Views on Vision4Press platform.
Data correspond to usage on the plateform after 2015. The current usage metrics is available 48-96 hours after online publication and is updated daily on week days.
Initial download of the metrics may take a while.