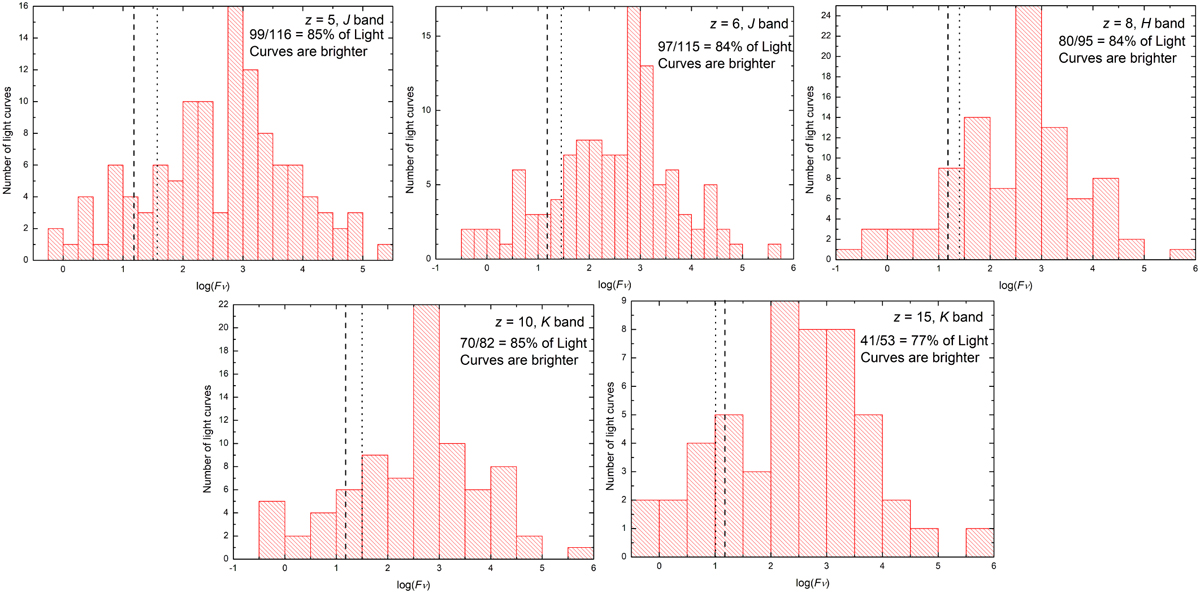
Fig. 4
Download original image
Distribution of early GRB afterglow luminosities. These are measured at 245 s, the logarithmic center of an observation stretching from 100 s to 600 s after the trigger in the observer frame. The legends indicate to which redshiſt and which band the afterglows have been shifted, as well as the number of afterglows that are brighter than 15 µJy. The vertical dashed lines show the 15 µJy sensitivity requirement. The dotted vertical dashed line shows the flux threshold required to recover 80% of redshiſts, which exceeds the requirement for all but ɀ ≃ 15.
Current usage metrics show cumulative count of Article Views (full-text article views including HTML views, PDF and ePub downloads, according to the available data) and Abstracts Views on Vision4Press platform.
Data correspond to usage on the plateform after 2015. The current usage metrics is available 48-96 hours after online publication and is updated daily on week days.
Initial download of the metrics may take a while.