Fig. 3
Download original image
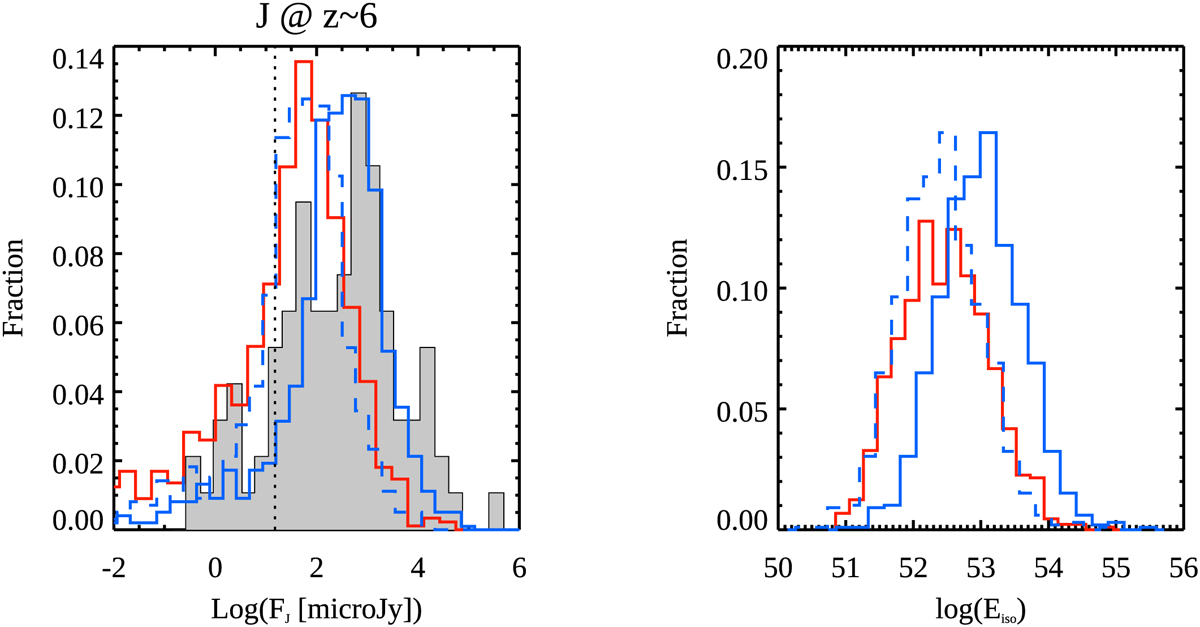
Simulated GRB samples detectable by Swift and Gamow at z ~ 6. Right panel: distributions of the isotropic equivalent energy of simulated Swift (blue) and Gamow LEXT (red) GRBs. The dashed histograms in the right-hand panel corresponds to a rescaling of the Swift GRB distribution by a factor ~4 to reproduce the Gamow (red) distribution. Left panel: afterglow flux density distributions in the J band. This corresponds to the central frequency 1.84 × 10¹⁴ Hz of observed Swift GRBs (solid filled gray histogram from Fig. 2) compared with the distribution of J flux densities at 560 s (observer frame) of simulated Swift bursts (blue histogram) and simulated LEXT GRBs (red histogram). The dashed blue histogram shows the afterglow flux density rescaled by the energy factor ratio (see text). Dotted vertical line shows the flux density threshold of 15 µJy.
Current usage metrics show cumulative count of Article Views (full-text article views including HTML views, PDF and ePub downloads, according to the available data) and Abstracts Views on Vision4Press platform.
Data correspond to usage on the plateform after 2015. The current usage metrics is available 48-96 hours after online publication and is updated daily on week days.
Initial download of the metrics may take a while.