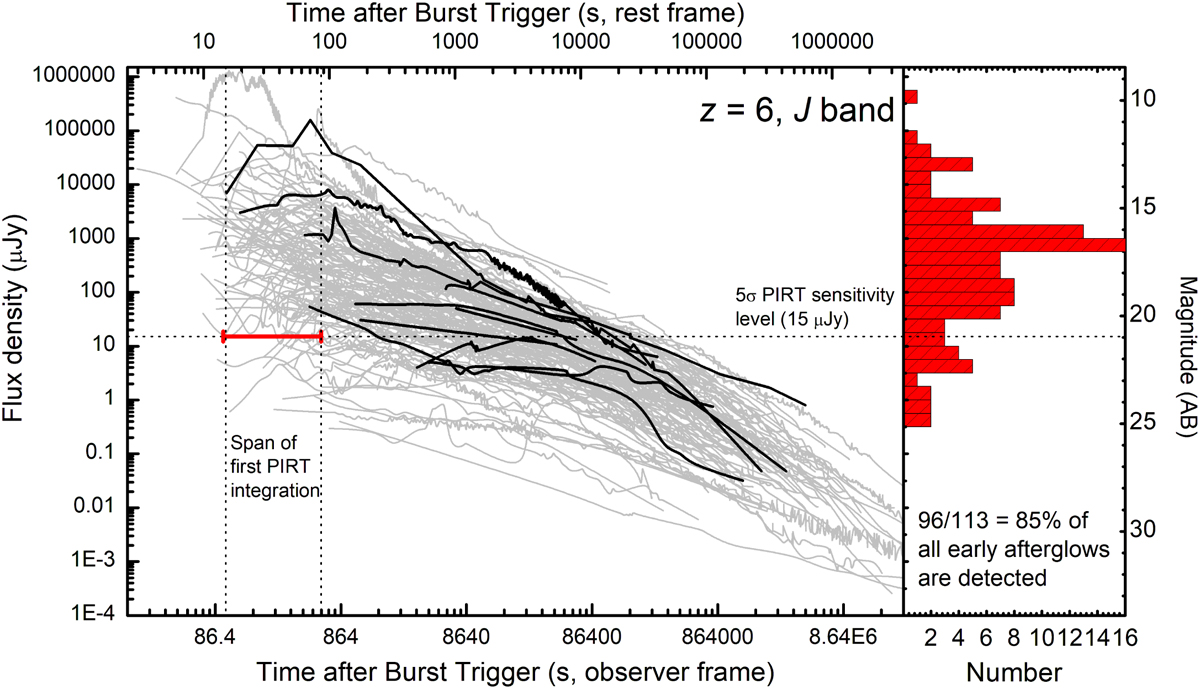
Fig. 2
Download original image
Light curves of GRB afterglows and the sensitivity of the initial Gamow image. Afterglow light curves have been corrected for Galactic extinction, host extinction, and, where necessary, for the host-galaxy and supernova components. All afterglows are shifted to ɀ = 6 using knowledge of the intrinsic spectral slope, and flux densities have been converted to the J band. Thick black lines are the high-ɀ sample of GRB afterglows lying at ɀ ≳ 6. It can be seen that they agree with the distribution of afterglow luminosities at lower redshifts. The red horizontal bar with arrows represents the time span of the first image Gamow will take after slewing to a GRB position, a 500 s integration which we assume starts at 100 s after the trigger and reaches a limit of 15 µJy (21 mag in the AB system). The situation for the J band at ɀ = 5, the H band at ɀ = 8, and the K band at ɀ = 10, ɀ = 15 are similar, the time dilation and distance-induced luminosity decrease mostly cancel each other out for the higher redshifts. The distribution of afterglow brightness during the first 1000 s after the GRB trigger is shown in the histogram in the right panel.
Current usage metrics show cumulative count of Article Views (full-text article views including HTML views, PDF and ePub downloads, according to the available data) and Abstracts Views on Vision4Press platform.
Data correspond to usage on the plateform after 2015. The current usage metrics is available 48-96 hours after online publication and is updated daily on week days.
Initial download of the metrics may take a while.