Fig. 1

Download original image
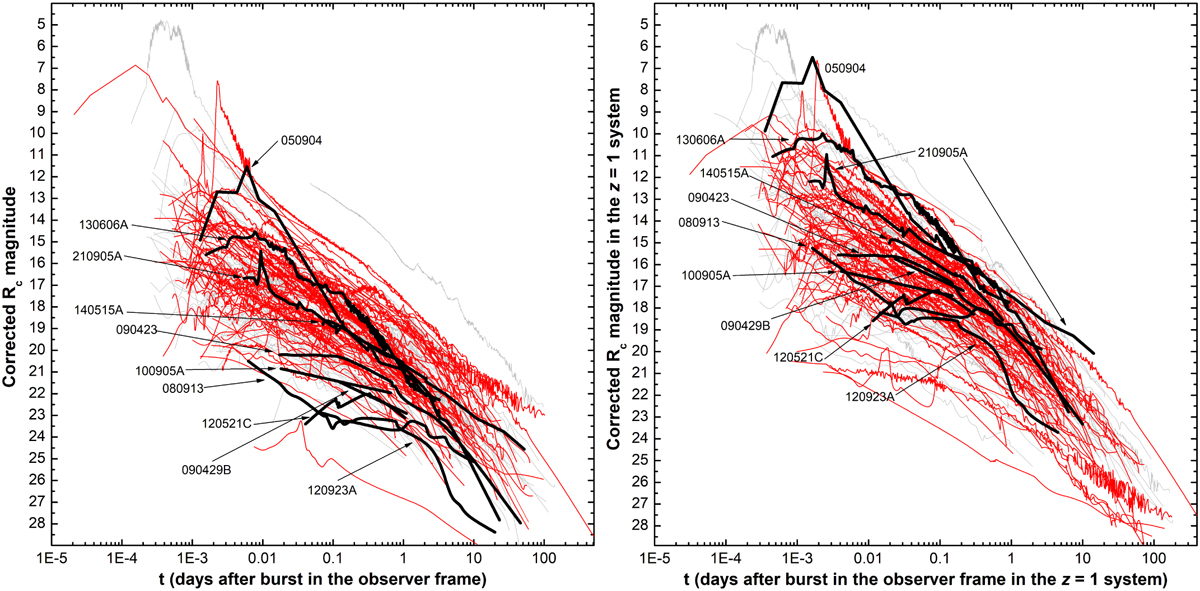
GRB afterglow sample from 2008 to 2021. Left panel: the observer frame light curves. These have been corrected for Galactic foreground extinction as well as, where applicable, the host-galaxy contribution and the supernova contribution. Light-gray curves represent the pre-Swift and Swift era samples of K6, K10, K11 (Type II GRB afterglows only). Red curves represent new GRB afterglow light curves presented in this work. Thick black curves represent the ɀ ≳ 6 high-ɀ sample. These light curves have been constructed by using the intrinsic spectral slopes to extrapolate the magnitude from redder bands to the RC band, essentially assuming the Universe is completely transparent. For these, the GRBs are labeled. Right panel: GRB afterglow light curves when shifted to all originate from ɀ = 1. See text for more details.
Current usage metrics show cumulative count of Article Views (full-text article views including HTML views, PDF and ePub downloads, according to the available data) and Abstracts Views on Vision4Press platform.
Data correspond to usage on the plateform after 2015. The current usage metrics is available 48-96 hours after online publication and is updated daily on week days.
Initial download of the metrics may take a while.


